Stock · TECHM · Information Technology
TECHM share price target 2026
Support, resistance, the F&O structure and the BazaarBaazi Crack Score for TECH MAHINDRA LIMITED, refreshed every end-of-day run. A systematic, data-only read on TECH MAHINDRA LIMITED: where it trades versus its 50-day and 200-day lines, the live 52-week range, and momentum, refreshed from the scanner's real price series each run.
The verdict
BazaarBaazi reads TECHM as constructive with a Crack Score of 82/100 as of 21 Jul 2026.
BazaarBaaziSource & method
The scanner's readNear-perfect · scanned 31 Jul 2026
Where TECHM stands on the 500-name BazaarBaazi setup scanner: technicals, filed fundamentals and money flow read together, refreshed every run.
One directional side cleared its price-structure, filed-evidence and signed money-flow gates with no blocking red flag.
Technical axis
100/100Fundamental axis
100/100Money flow
80/100Result pulse · Q1 FY27
87/100Named setups in force
- stage2 uptrend
- fresh golden cross
- under accumulation
- RS leader
- earnings acceleration
- result winner
Technical evidence
price above 50DMA
price above 150DMA
price above 200DMA
50 > 150 > 200 DMA (clean stack)
golden cross 7 bars ago
price above 50DMA
ADX 27.6 (trend building)
RSI 71.9 (momentum up)
money-flow score 80.2/100
Chaikin money flow +0.119 (accumulation)
up/down volume 1.42x (buyers dominant)
MFI 80.3
relative strength rising vs NIFTY
RS line near its highs (leadership)
RS slope +15.0% (3m)
outperforming and above 50DMA
Fundamental evidence
net profit +31.67% YoY
revenue +17.68% YoY
net margin 9.46%
result score 87.0/100
result score 87.0/100 (top tier)
strong filed quarter
profit up YoY
revenue up YoY
Valuation and context
P/E 28.5 vs sector median 25.5 (1.12x, 56th pctile)
P/E 1.43x its own ~15m median (20.0)
Relative valuation
P/E (TTM)
28.5P/E vs sector
+1.1%Sector percentile
56PEG
0.90Growth gap
-1.9%P/E vs own history
+1.4%The engine's trade frame
Entry zone
1,651.3Stop
1,559.0Target 1
1,835.9Target 2
1,928.3Risk / reward
5.6% risk · 2.0RScanner levels from the deterministic engine run of 2026-07-31, not a SEBI-registered recommendation and not investment advice. The fundamental axis reads the official filing: Q1 FY27 result.
Price target: support and resistanceComputed 21 Jul 2026
Support and resistance for TECHM are read inside the latest show; no spot was printed in the most recent editorial note.
Levels are read inside the latest show. The most recent editorial reference is Systematic Read on 21 Jul 2026.
These are structural reference lines, not a SEBI-registered price target. BazaarBaazi is independent media; the levels frame how the desk reads the TECHM chart, refreshed every end-of-day run.
The Crack Score, and how it is built82 / 100 · High conviction
The Crack Score is a deterministic 0 to 100 conviction number. Here is exactly what moved it for TECHM, so the figure is a transparent signal rather than a vibe.
Base 50, adjusted by the factors above and clamped to 0 to 100. How the Crack Score works.
About TECH MAHINDRA LIMITEDBusiness profile
What TECHM actually does, and the edge that holds its position.
Tech Mahindra is India's fifth-largest IT services company by revenue, with a historically strong telecom vertical serving global carriers, equipment vendors, and network technology companies, alongside a growing enterprise segment in banking, healthcare, manufacturing, and retail. The company is a joint venture partner of British Telecom origin, and its telecom practice has been its flagship differentiator. Tech Mahindra also runs a business process services division and has been investing in AI, 5G network services, and digital engineering.
Tech Mahindra's telecom vertical depth, built over decades of serving global carriers on network OSS/BSS systems and 5G deployment, is a genuine moat in a segment that requires specialised domain knowledge most IT companies lack. The 5G rollout globally and the network virtualisation trend are natural growth vectors for this expertise.
The F&O viewHorizon · swing
How the futures and options structure on TECHM reads right now.
The editorial price read on TECHM is bullish. Strike-level option inventory is unavailable, so the page withholds writer, wall and pin claims. Single-stock F&O on TECHM can be thinner than index F&O, so the desk weights price and filed evidence over raw OI. This is not a derivatives trade recommendation.
Why it movedLatest editorial line
The most recent BazaarBaazi read on what is driving TECHM.
Systematic read: a disclosed, data-only model on real 1-year price structure.
Read in Systematic Read on 21 Jul 2026. Why TECHM moved, the living explainer, tracks every move on one URL.
The 2026 to 2030 pictureStructural read
What genuinely drives TECHM over a multi-year horizon. A structural read, not a price forecast.
The 2026 to 2030 horizon for Tech Mahindra is about whether the 5G-led telecom investment cycle translates into large deal wins in network services, and whether the enterprise segment can diversify the revenue mix away from a telecom vertical that has faced capex cuts from major carriers. The company's turnaround strategy under newer leadership is focused on improving utilisation, margin, and deal-win velocity. The key risk is that telecom carriers, facing their own revenue pressure, continue to constrain IT spend.
What to watch:
- Telecom vertical revenue and deal-TCV trends as 5G investment cycles evolve
- Enterprise segment growth in banking, healthcare, and manufacturing verticals
- Operating margin recovery and cost-structure improvement
- AI and 5G network services practice deal wins
- Large deal ramp-ups and their revenue contribution timeline
Peers and how to compare4 listed names
The listed names TECHM is most often read against. Compare them on the same Crack Score and levels.
Stored valuation readStored 2026-10-19
P/E, P/B, yield and the quality set for TECH MAHINDRA LIMITED, computed only from the stored fundamentals snapshot dated 2026-10-19. No carried market price is presented as current.
P / E
28.6x
Earnings yield
3.50%
P / B
5.31x
P / S
2.57x
EV / EBITDA
15.3x
Dividend yield
2.87%
Market cap
Rs 1.58 lakh cr
Enterprise value
Rs 1.52 lakh cr
Stored from TECH MAHINDRA LIMITED's filed results, as of 2026-10-19 and currency-checked. Price input Rs 1,779.10 from baked EOD spot. Open the calculator, move the price and watch every ratio react.
Latest filed resultsQ1 FY27
TECH MAHINDRA LIMITED's most recent quarter, parsed straight from the official NSE filing. Every figure links back to its primary source.
Result Pulse
87 / 100Revenue
Rs 15,712 crNet profit
Rs 1,486 crEPS (quarter)
Rs 16.53| Growth | YoY | QoQ |
|---|---|---|
| Revenue | +17.7% | n/a |
| Net profit | +31.7% | n/a |
| Net margin | +9.5% | |
Figures are the Q1 FY27 result for TECH MAHINDRA LIMITED, parsed straight from the official NSE integrated filing and verified to the paisa. The EPS shown is for the quarter, not a trailing-twelve-month figure, so it is not a P/E input.
Earnings history, every filed quarter33 quarters on record
TECH MAHINDRA LIMITED's official quarterly revenue, EPS and Result Pulse trail, every quarter the desk holds from the verified filings export, back to 30 Jun 2018. These are quarterly facts, not TTM valuation inputs.
TECHM official result trail
33 quarters
Quarterly figures only: revenue, net profit and EPS are copied from official filings. EPS here is not trailing twelve month EPS and is not used for valuation.
| Quarter | Revenue | EPS | PAT YoY | Pulse | Source |
|---|---|---|---|---|---|
| Q1 FY27ended 30 Jun 2026 / Consolidated, audited | Rs 15,712 cr | Rs 16.53 | +31.7% | 87/100 | Filing |
| Q4 FY26ended 31 Mar 2026 / Consolidated, audited | Rs 15,076 cr | Rs 15.27 | n/a | n/a | Filing |
| Q3 FY26ended 31 Dec 2025 / Consolidated, audited | Rs 14,393 cr | Rs 12.66 | n/a | 50/100 | Filing |
| Q2 FY26ended 30 Sep 2025 / Consolidated, audited | Rs 13,995 cr | Rs 13.48 | n/a | 50/100 | Filing |
| Q1 FY26ended 30 Jun 2025 / Consolidated, audited | Rs 13,351 cr | Rs 12.87 | n/a | 50/100 | Filing |
| Q4 FY25ended 31 Mar 2025 / Consolidated, audited | Rs 13,384 cr | Rs 13.17 | n/a | n/a | Filing |
| Q3 FY25ended 31 Dec 2024 / Consolidated, audited | Rs 13,286 cr | Rs 11.10 | n/a | n/a | Filing |
| Q2 FY25ended 30 Sep 2024 / Consolidated, audited | Rs 13,313 cr | Rs 14.12 | n/a | n/a | Filing |
| Q1 FY25ended 30 Jun 2024 / Consolidated, audited | Rs 13,005 cr | Rs 9.62 | n/a | n/a | Filing |
| Q4 FY24ended 31 Mar 2024 / Consolidated, audited | Rs 12,871 cr | Rs 7.47 | n/a | n/a | Filing |
| Q3 FY24ended 31 Dec 2023 / Consolidated, audited | Rs 13,101 cr | Rs 5.77 | n/a | n/a | Filing |
| Q2 FY24ended 30 Sep 2023 / Consolidated, audited | Rs 12,864 cr | Rs 5.59 | n/a | n/a | Filing |
| Q1 FY24ended 30 Jun 2023 / Consolidated, audited | Rs 13,159 cr | Rs 7.84 | n/a | n/a | Filing |
| Q4 FY23ended 31 Mar 2023 / Consolidated, audited | Rs 13,718 cr | Rs 12.67 | n/a | n/a | Filing |
| Q3 FY23ended 31 Dec 2022 / Consolidated, audited | Rs 13,735 cr | Rs 14.70 | n/a | n/a | Filing |
| Q2 FY23ended 30 Sep 2022 / Consolidated, audited | Rs 13,129 cr | Rs 14.58 | n/a | n/a | Filing |
| Q1 FY23ended 30 Jun 2022 / Consolidated, audited | Rs 12,708 cr | Rs 12.84 | n/a | n/a | Filing |
| Q4 FY22ended 31 Mar 2022 / Consolidated, audited | Rs 12,116 cr | Rs 17.09 | n/a | n/a | Filing |
| Q3 FY22ended 31 Dec 2021 / Consolidated, audited | Rs 11,451 cr | Rs 15.58 | n/a | n/a | Filing |
| Q2 FY22ended 30 Sep 2021 / Consolidated, audited | Rs 10,881 cr | Rs 15.26 | n/a | n/a | Filing |
| Q1 FY22ended 30 Jun 2021 / Consolidated, audited | Rs 10,198 cr | Rs 15.43 | n/a | n/a | Filing |
| Q4 FY21ended 31 Mar 2021 / Consolidated, audited | Rs 9,730 cr | Rs 12.37 | n/a | n/a | Filing |
| Q3 FY21ended 31 Dec 2020 / Consolidated, audited | Rs 9,647 cr | Rs 14.98 | n/a | n/a | Filing |
| Q2 FY21ended 30 Sep 2020 / Consolidated, audited | Rs 9,372 cr | Rs 12.18 | n/a | n/a | Filing |
| Q1 FY21ended 30 Jun 2020 / Consolidated, audited | Rs 9,106 cr | Rs 11.13 | n/a | n/a | Filing |
| Q4 FY20ended 31 Mar 2020 / Consolidated, audited | Rs 9,490 cr | Rs 9.21 | n/a | n/a | Filing |
| Q3 FY20ended 31 Dec 2019 / Consolidated, audited | Rs 9,655 cr | Rs 13.13 | n/a | n/a | Filing |
| Q2 FY20ended 30 Sep 2019 / Consolidated, audited | Rs 9,070 cr | Rs 12.88 | n/a | n/a | Filing |
| Q1 FY20ended 30 Jun 2019 / Consolidated, audited | Rs 8,653 cr | Rs 10.98 | n/a | n/a | Filing |
| Q4 FY19ended 31 Mar 2019 / Consolidated, audited | Rs 8,892 cr | Rs 12.77 | n/a | n/a | Filing |
| Q3 FY19ended 31 Dec 2018 / Consolidated, audited | Rs 8,944 cr | Rs 13.55 | n/a | n/a | Filing |
| Q2 FY19ended 30 Sep 2018 / Consolidated, audited | Rs 8,630 cr | Rs 11.99 | n/a | n/a | Filing |
| Q1 FY19ended 30 Jun 2018 / Consolidated, audited | Rs 8,276 cr | Rs 10.12 | n/a | n/a | Filing |
The official financialsFiled to 31 Mar 2026
TECH MAHINDRA LIMITED's statements as filed: trailing twelve month P&L, the balance sheet, and the cash engine. Parsed from official XBRL, shown in crore.
Trailing twelve months, on filed quarters
Revenue (TTM)
56,815 crNet profit (TTM)
4,806 crEBIT (TTM)
6,911 crProfit before tax (TTM)
6,573 crNet margin (TTM)
8.5%Finance costs (TTM)
337 crBalance sheet, as filed 2026-03-31
Total assets
49,369 crShareholder equity
30,077 crTotal borrowings
2,186 crCash and equivalents
5,046 crInventory
104 crTrade receivables
13,358 crThe cash engine, latest filed year
Operating cash flow
6,172 crCapex
696 crFree cash flow
5,476 crInvesting flow
-409 crFinancing flow
-5,131 crAnnual trail, filed year over filed year
| Year | Revenue | Net profit | Equity | Borrowings | CFO |
|---|---|---|---|---|---|
| FY26 | 56,815 cr | 4,806 cr | 30,077 cr | 2,186 cr | 6,172 cr |
| FY25 | 52,988 cr | 4,253 cr | 27,792 cr | 2,025 cr | 5,786 cr |
| FY24 | 51,995 cr | 2,397 cr | 27,147 cr | 1,531 cr | 6,376 cr |
| FY23 | 53,290 cr | 4,857 cr | 28,395 cr | 1,578 cr | 5,572 cr |
| FY22 | 44,646 cr | 5,630 cr | 27,381 cr | 1,582 cr | 5,285 cr |
| FY21 | 37,855 cr | 4,353 cr | 25,245 cr | 1,662 cr | n/a |
Every figure is parsed from TECH MAHINDRA LIMITED's official NSE XBRL filings by the BazaarBaazi earnings lab and shown in crore rupees. Display data, not a valuation model input.
Management on record23 earnings calls
Every TECHM earnings call BazaarBaazi has indexed, latest 30 Apr 2026. Read management in its own words, straight from the filed transcript.
TECH MAHINDRA LIMITED earnings calls on record
23 calls since 31 Aug 2020
Show 15 older calls
Each entry links to the transcript PDF the company filed with the exchange. Primary sources, in management's own words.
What changed68 disclosures
Every recent official filing from TECH MAHINDRA LIMITED, straight from the exchange feed, with the BazaarBaazi Event Heat on the disclosure flow.
TECH MAHINDRA LIMITED has filed 68 official disclosures recently. The most recent is a Credit rating dated 28 Jul 2026.
Disclosure under Regulation 30 of the Securities and Exchange Board of India (Listing Obligations and Disclosure Requirements) Regulations, 2015 ( SEBI Listing Regulations ) ESG Rating
allotment of 26848 securities pursuant to ESOP/ESPS at its meeting held on July 21, 2026
Notice to Shareholders regarding Scheme of Merger between Zen3 Infosolutions Private Limited, Tech Mahindra Enterprise Services Limited, Begig Private Limited and Tech Mahindra Limited
Event Heat is withheld because the reproducible what-changed window is unavailable. Every line above links to its official exchange filing, and the full market desk is at the disclosures hub.
Key fundamentalsEditorial reference
The anchor data BazaarBaazi references when reading the TECHM chart. Not a substitute for a registered research note.
| Ticker | TECHM |
|---|---|
| Full name | TECH MAHINDRA LIMITED |
| Sector | Information Technology |
| Index class | LARGE CAP |
| ISIN | INE669C01036 |
| Market-cap band | ~1.4 lakh cr (indicative) |
| Last referenced level | Inside latest show |
| Last session move | Not referenced this cycle |
| Editorial line in | Systematic Read on 21 Jul 2026 |
| Aliases tracked | TECHM |
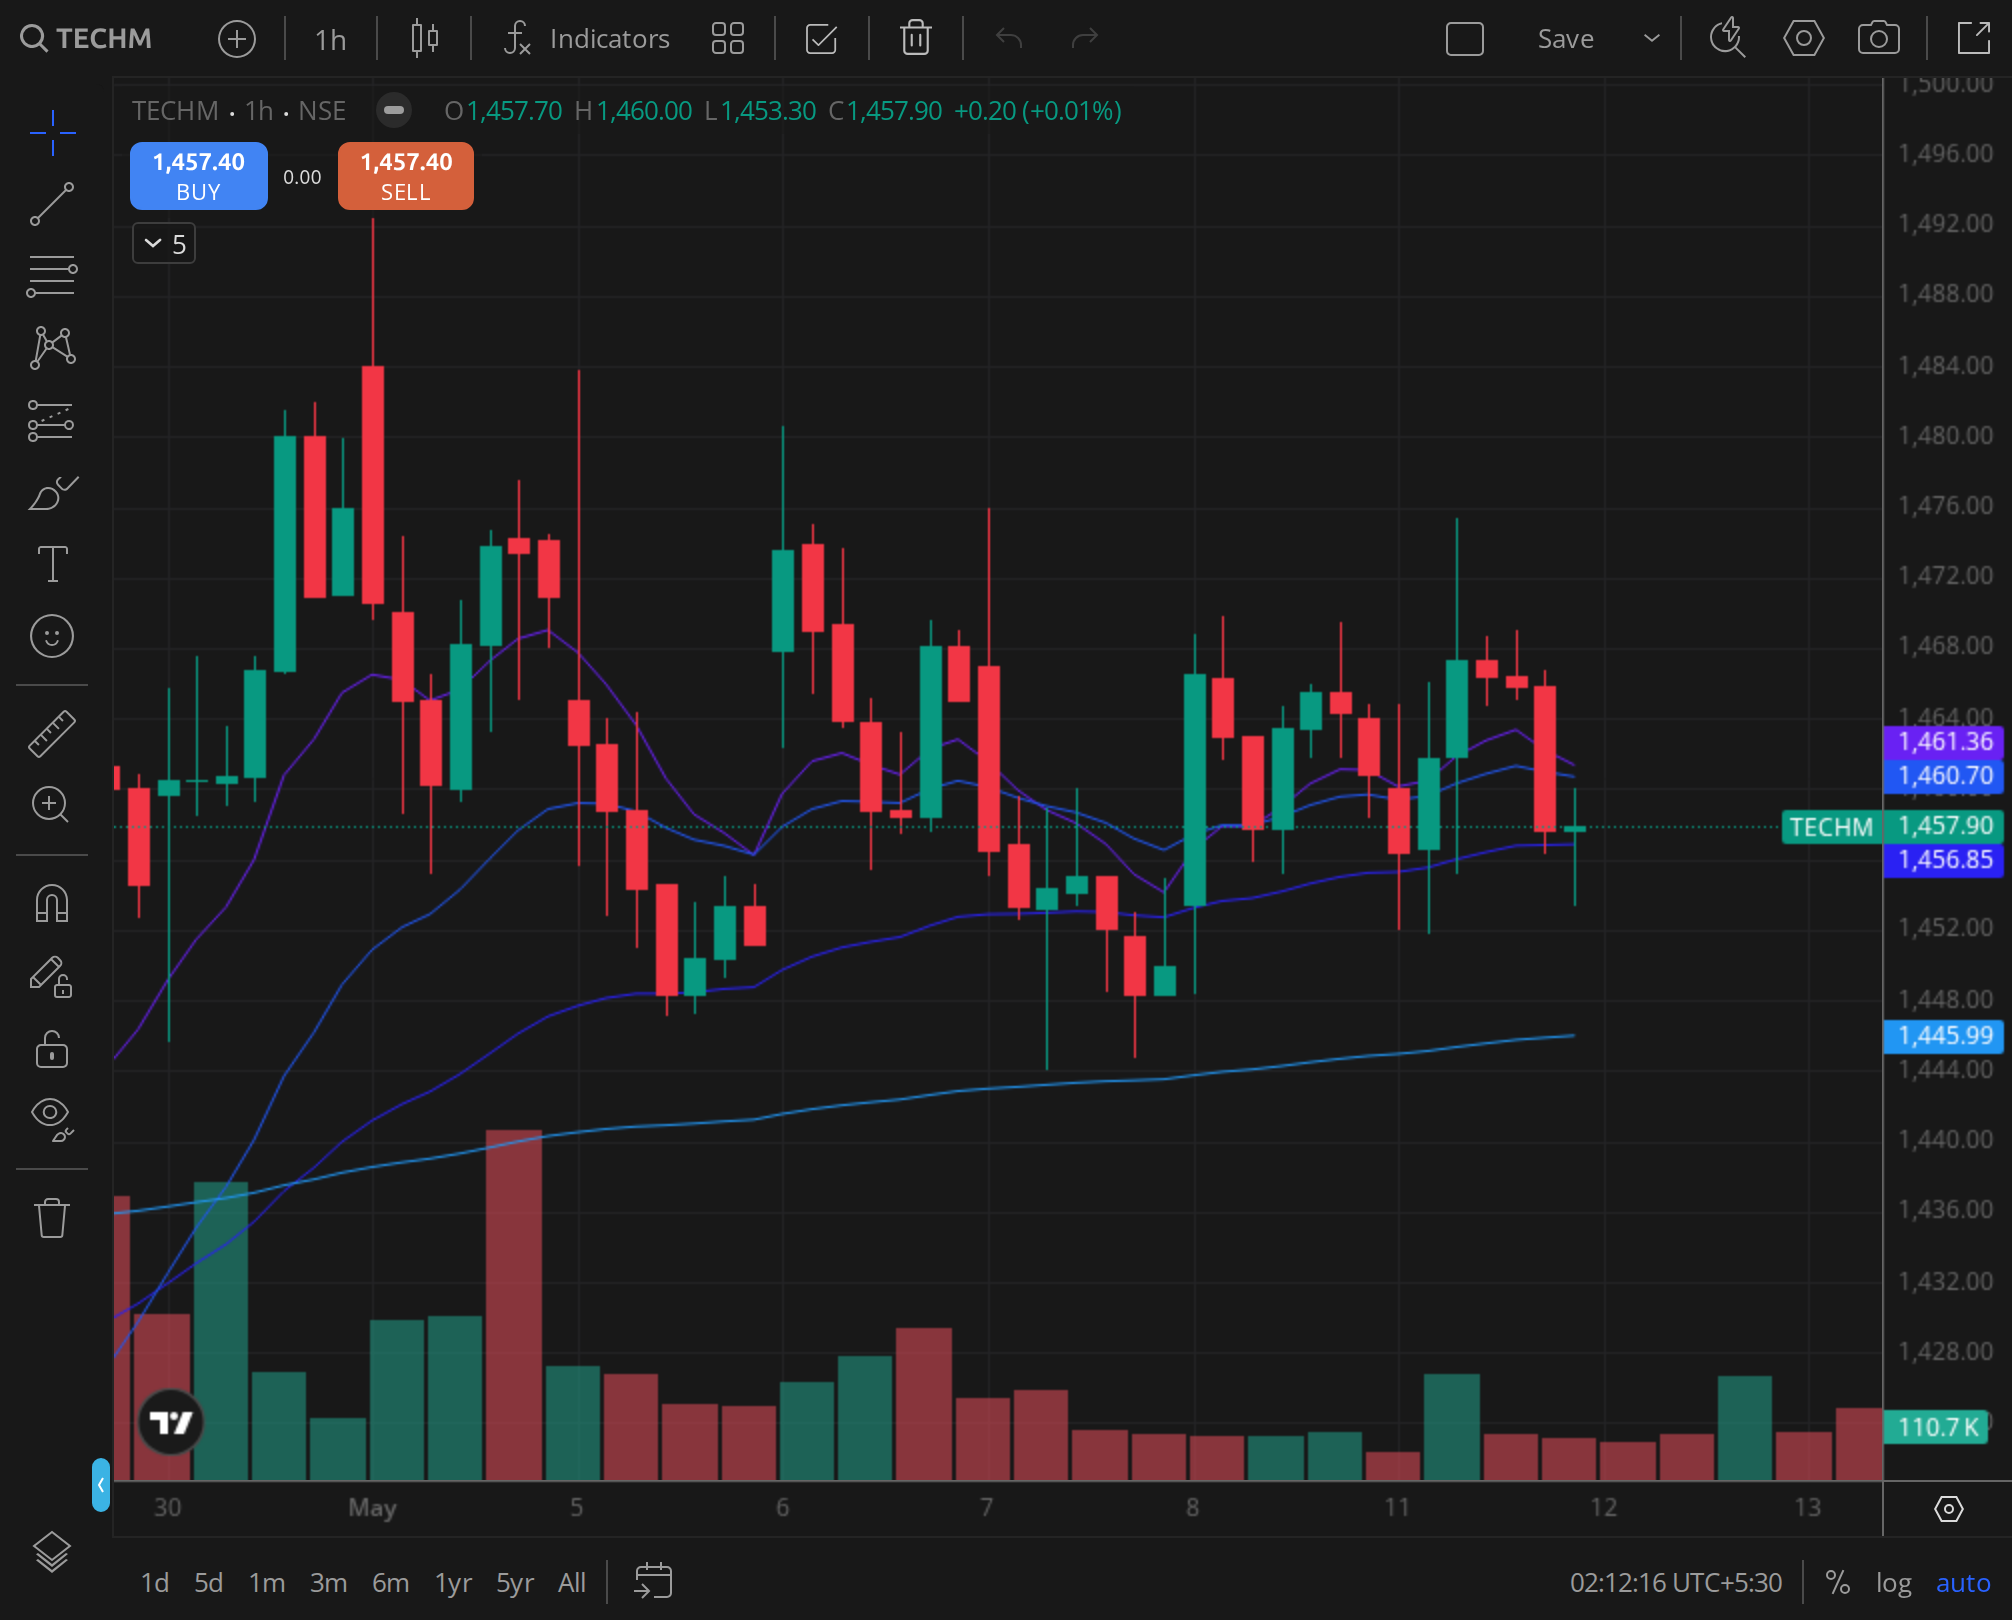
Reference chart25 Apr 2025
The daily frame the desk reads on TECHM.
FAQ17 reader questions · AEO-eligible
The line on TECHM, distilled and schema-marked for AI Overview, Perplexity, and reader search.
What is the TECHM share price target for 2026?
BazaarBaazi does not publish a SEBI-registered price target on TECHM. The desk reads structural support and resistance inside each show against the printed spot; the most recent editorial line is Systematic Read on 21 Jul 2026.
What is BazaarBaazi's Crack Score for TECHM?
The BazaarBaazi Crack Score for TECHM is 82 out of 100 as of 21 Jul 2026, a high conviction reading. It is a computed conviction number from the signed stance, how consistent the recent verdicts have been, the quality of the printed structure, and how fresh the review is. It is a transparency signal, not investment advice.
What is the F&O view on TECHM?
Strike-level option inventory for TECHM is unavailable, so BazaarBaazi withholds participant, direction and positioning claims. The editorial chart stance is not substituted for an option-chain observation.
What sector is TECHM in and which peers does BazaarBaazi track?
TECHM sits in Information Technology (large cap), indicative market cap ~1.4 lakh cr (indicative), ISIN INE669C01036. The peers BazaarBaazi reads alongside it are INVENTURUS KNOWLEDGE SOLUTIONS LIMITED, NEWGEN SOFTWARE TECHNOLOGIES LIMITED, Mphasis Limited. A systematic, data-only read on TECH MAHINDRA LIMITED: where it trades versus its 50-day and 200-day lines, the live 52-week range, and momentum, refreshed from the scanner's real price series each run.
How often is the TECHM view updated?
This page is one evergreen URL refreshed in place. The Crack Score and levels re-compute on every BazaarBaazi end-of-day run, and the dated stamp shows the last refresh. The latest signed verdict on TECHM is bullish, published in Systematic Read on 21 Jul 2026.
Is Tech Mahindra a good long-term stock?
Tech Mahindra is the leading Indian IT company in the telecom vertical, positioned to benefit from global 5G network services demand. The long-term case also rests on enterprise diversification and margin recovery. BazaarBaazi publishes a Crack Score for current market positioning.
Tech Mahindra share price target 2030?
BazaarBaazi does not publish a fixed 2030 price target for TECHM. The drivers over that horizon are 5G deal flow, enterprise segment expansion, and margin trajectory. See the dated Crack Score on the BazaarBaazi TECHM page.
Why is Tech Mahindra share price falling?
TECHM corrects when telecom-sector IT spending weakens, when large-deal ramps are delayed, or when operating margins miss expectations during transformation investment phases. Broader IT sector de-ratings and deal cancellations in telecom also weigh on the stock. Check the current Crack Score on the BazaarBaazi page.
Is TECHM a qualifying setup on the BazaarBaazi scanner right now?
On the 2026-07-31 run of the 500-name BazaarBaazi setup scanner, TECH MAHINDRA LIMITED sits in the Near-perfect tier with a setup score of 96/100 (technical 100, fundamental 100). The scanner is a deterministic engine over real OHLCV and official filings, refreshed nightly, and it is a signal rather than investment advice.
Where can I read TECH MAHINDRA LIMITED's earnings call transcripts?
BazaarBaazi indexes 23 TECHM earnings calls going back to 2020-08-31, latest 2026-04-30. Every entry on this page links straight to the transcript PDF the company filed with the exchange, so you read management in the primary source.
What was TECH MAHINDRA LIMITED's Q1 FY27 net profit?
TECH MAHINDRA LIMITED reported a net profit of Rs 1,486 cr for Q1 FY27 (the quarter ended 31 March 2026). That is +31.7% year on year. The figure is from the company's official NSE filing.
What was TECH MAHINDRA LIMITED's Q1 FY27 revenue?
TECH MAHINDRA LIMITED reported revenue of Rs 15,712 cr for Q1 FY27. That is +17.7% year on year. The figure is from the company's official NSE filing.
How does BazaarBaazi rate TECH MAHINDRA LIMITED's Q1 FY27 result?
BazaarBaazi gives TECH MAHINDRA LIMITED's Q1 FY27 result a Result Pulse of 87 out of 100, with a verdict of Profit acceleration. The Result Pulse is a BazaarBaazi editorial score for the quality of the filed result, not investment advice.
What has Tech Mahindra Ltd announced recently?
Tech Mahindra Ltd's two most material recent disclosures are a credit rating dated 28 Jul 2026, "Regulation 30 of the Securities and Exchange Board of…", and an investor meet dated 24 Jul 2026, "Schedule of meet". Both link to the company's own official filing on the BazaarBaazi stock page.
Has Tech Mahindra Ltd declared a dividend recently?
Yes. Tech Mahindra Ltd filed a dividend disclosure on 03 Jul 2026, filed as "Dividend - Rs 36 Per Share". Any amount shown is the exchange's own record, linked from the BazaarBaazi stock page. A dividend is a declared payout, not a forecast of future returns.
What did Tech Mahindra Ltd's latest board meeting cover?
Tech Mahindra Ltd's most recent board-meeting disclosure on record dated 16 Jul 2026 reads "Outcome of Board Meeting held on July 16, 2026". That is the agenda as filed with the exchange, linked from the BazaarBaazi stock page, and BazaarBaazi adds no claim of its own to it.
Has Tech Mahindra Ltd's credit rating been updated recently?
Tech Mahindra Ltd filed a credit-rating disclosure on 28 Jul 2026, recorded with the exchange as "Regulation 30 of the Securities and Exchange Board of India (Listing…". The detail sits in the linked filing on the BazaarBaazi stock page. A rating action is an agency view on debt, separate from the share price.
Related stock views
The names BazaarBaazi reads alongside TECHM, each a living view refreshed every end-of-day run.
Hub
All stock views
The full BazaarBaazi coverage universe, scored and dated.
Information Technology
IKS
INVENTURUS KNOWLEDGE SOLUTIONS LIMITED
Information Technology
NEWGEN
NEWGEN SOFTWARE TECHNOLOGIES LIMITED
Information Technology
MPHASIS
Mphasis Limited
Information Technology
AFFLE
Affle 3i Limited
Information Technology
BSOFT
Birlasoft Limited