Stock · TCS · IT services
TCS share price target 2026
Support, resistance, the F&O structure and the BazaarBaazi Crack Score for Tata Consultancy Services Ltd, refreshed every end-of-day run. Concentration not breadth. Single-stock index contribution, BFSI client mix, and the deal-TCV print that decides the IT-pack regime.
The verdict
BazaarBaazi reads TCS as range-bound with a Crack Score of 66/100 as of 31 Jul 2026.
BazaarBaaziSource & method
The scanner's readScanned · scanned 31 Jul 2026
Where TCS stands on the 500-name BazaarBaazi setup scanner: technicals, filed fundamentals and money flow read together, refreshed every run.
Scanned and scored this run, but the evidence is incomplete or conflicted. The engine fails closed to NO_TRADE.
Technical axis
86/100Fundamental axis
100/100Money flow
67/100Result pulse · Q1 FY27
70/100Technical evidence
Chaikin money flow +0.074 (accumulation)
up/down volume 1.1x (buyers dominant)
MFI 79.7
net +6 accumulation days (25d)
Fundamental evidence
net margin 18.57% (high)
result score 70.0/100
profit not shrinking YoY
revenue +13.93% YoY
Red flags
below 200DMA (not a long-side trend)
Relative valuation
P/E (TTM)
17.2P/E vs sector
+0.7%Sector percentile
15PEG
3.67Scanner levels from the deterministic engine run of 2026-07-31, not a SEBI-registered recommendation and not investment advice. The fundamental axis reads the official filing: Q1 FY27 result.
Price target: support and resistanceComputed 31 Jul 2026
Support and resistance for TCS are read inside the latest show; no spot was printed in the most recent editorial note.
Levels are read inside the latest show. The most recent editorial reference is Closing Bell Flash on 31 Jul 2026.
These are structural reference lines, not a SEBI-registered price target. BazaarBaazi is independent media; the levels frame how the desk reads the TCS chart, refreshed every end-of-day run.
The Crack Score, and how it is built66 / 100 · Constructive
The Crack Score is a deterministic 0 to 100 conviction number. Here is exactly what moved it for TCS, so the figure is a transparent signal rather than a vibe.
Base 50, adjusted by the factors above and clamped to 0 to 100. How the Crack Score works.
About Tata Consultancy Services LtdBusiness profile
What TCS actually does, and the edge that holds its position.
Tata Consultancy Services is India's largest IT services company by revenue and one of the largest in the world, delivering technology services, consulting, and digital transformation to clients in over fifty countries. Its verticals span banking and financial services, retail, life sciences, manufacturing, and communications, with a strong bias toward large, complex, multi-year managed services contracts. TCS is a publicly listed subsidiary of Tata Sons, which holds a majority stake.
TCS's scale, delivery consistency, and decades of institutional trust with global CIOs make it the first call for mission-critical IT outsourcing. Its BFSI vertical depth, particularly in banking legacy modernisation, is a moat that smaller IT companies and boutique consultants find difficult to enter because the risk of failure in financial-system migration is too high for clients to take a chance on an unknown vendor.
The F&O viewHorizon · 1d
How the futures and options structure on TCS reads right now.
The editorial price read on TCS is neutral. Strike-level option inventory is unavailable, so the page withholds writer, wall and pin claims. Single-stock F&O on TCS can be thinner than index F&O, so the desk weights price and filed evidence over raw OI. This is not a derivatives trade recommendation.
Why it movedSession -2.68%
The most recent BazaarBaazi read on what is driving TCS.
TCS lost -2.68%, INFY fell -2.18%, and WIPRO slipped -1.56%.
Read in Closing Bell Flash on 31 Jul 2026. Why TCS moved, the living explainer, tracks every move on one URL.
The 2026 to 2030 pictureStructural read
What genuinely drives TCS over a multi-year horizon. A structural read, not a price forecast.
The 2026 to 2030 horizon for TCS is whether it can sustain revenue growth in a period of AI-led enterprise transformation where some traditional IT headcount-driven work gets automated. TCS has been investing in its own AI and automation platforms to position for this shift. The structural tailwind is that every enterprise globally needs technology modernisation; TCS wins when that need is large enough to require a trusted partner at scale.
What to watch:
- Order book TCV and large-deal pipeline composition across geographies
- Constant-currency revenue growth in BFSI and retail verticals
- Operating margin and employee utilisation trends
- AI-service practice revenue as a share of total
- US dollar and pound sterling currency exposure and hedging strategy
Peers and how to compare4 listed names
The listed names TCS is most often read against. Compare them on the same Crack Score and levels.
Stored valuation readStored 2026-10-19
P/E, P/B, yield and the quality set for Tata Consultancy Services Ltd, computed only from the stored fundamentals snapshot dated 2026-10-19. No carried market price is presented as current.
P / E
17.3x
Earnings yield
5.80%
P / B
7.48x
P / S
3.14x
EV / EBITDA
11.7x
Dividend yield
1.95%
Market cap
Rs 8.90 lakh cr
Enterprise value
Rs 8.51 lakh cr
Stored from Tata Consultancy Services Ltd's filed results, as of 2026-10-19 and currency-checked. Price input Rs 2,460.90 from baked EOD spot. Open the calculator, move the price and watch every ratio react.
Latest filed resultsQ1 FY27
Tata Consultancy Services Ltd's most recent quarter, parsed straight from the official NSE filing. Every figure links back to its primary source.
Result Pulse
70 / 100Revenue
Rs 72,275 crNet profit
Rs 13,420 crEPS (quarter)
Rs 36.90| Growth | YoY | QoQ |
|---|---|---|
| Revenue | +13.9% | n/a |
| Net profit | +4.7% | n/a |
| Net margin | +18.6% | |
Figures are the Q1 FY27 result for Tata Consultancy Services Limited, parsed straight from the official NSE integrated filing and verified to the paisa. The EPS shown is for the quarter, not a trailing-twelve-month figure, so it is not a P/E input.
Earnings history, every filed quarter32 quarters on record
Tata Consultancy Services Ltd's official quarterly revenue, EPS and Result Pulse trail, every quarter the desk holds from the verified filings export, back to 30 Sep 2018. These are quarterly facts, not TTM valuation inputs.
TCS official result trail
32 quarters
Quarterly figures only: revenue, net profit and EPS are copied from official filings. EPS here is not trailing twelve month EPS and is not used for valuation.
| Quarter | Revenue | EPS | PAT YoY | Pulse | Source |
|---|---|---|---|---|---|
| Q1 FY27ended 30 Jun 2026 / Consolidated, audited | Rs 72,275 cr | Rs 36.90 | +4.7% | 70/100 | Filing |
| Q4 FY26ended 31 Mar 2026 / Consolidated, audited | Rs 70,698 cr | Rs 37.92 | n/a | n/a | Filing |
| Q3 FY26ended 31 Dec 2025 / Consolidated, audited | Rs 67,087 cr | Rs 29.45 | n/a | 52/100 | Filing |
| Q2 FY26ended 30 Sep 2025 / Consolidated, audited | Rs 65,799 cr | Rs 33.37 | n/a | 58/100 | Filing |
| Q1 FY26ended 30 Jun 2025 / Consolidated, audited | Rs 63,437 cr | Rs 35.27 | n/a | 58/100 | Filing |
| Q4 FY25ended 31 Mar 2025 / Consolidated, audited | Rs 64,479 cr | Rs 33.79 | n/a | 58/100 | Filing |
| Q3 FY25ended 31 Dec 2024 / Consolidated, audited | Rs 63,973 cr | Rs 34.21 | n/a | n/a | Filing |
| Q2 FY25ended 30 Sep 2024 / Consolidated, audited | Rs 64,259 cr | Rs 32.92 | n/a | n/a | Filing |
| Q1 FY25ended 30 Jun 2024 / Consolidated, audited | Rs 62,613 cr | Rs 33.28 | n/a | n/a | Filing |
| Q4 FY24ended 31 Mar 2024 / Consolidated, audited | Rs 61,237 cr | Rs 34.37 | n/a | n/a | Filing |
| Q3 FY24ended 31 Dec 2023 / Consolidated, audited | Rs 60,583 cr | Rs 30.29 | n/a | n/a | Filing |
| Q2 FY24ended 30 Sep 2023 / Consolidated, audited | Rs 59,692 cr | Rs 31.00 | n/a | n/a | Filing |
| Q1 FY24ended 30 Jun 2023 / Consolidated, audited | Rs 59,381 cr | Rs 30.26 | n/a | n/a | Filing |
| Q4 FY23ended 31 Mar 2023 / Consolidated, audited | Rs 59,162 cr | Rs 31.14 | n/a | n/a | Filing |
| Q3 FY23ended 31 Dec 2022 / Consolidated, audited | Rs 58,229 cr | Rs 29.64 | n/a | n/a | Filing |
| Q2 FY23ended 30 Sep 2022 / Consolidated, audited | Rs 55,309 cr | Rs 28.51 | n/a | n/a | Filing |
| Q1 FY23ended 30 Jun 2022 / Consolidated, audited | Rs 52,758 cr | Rs 25.90 | n/a | n/a | Filing |
| Q4 FY22ended 31 Mar 2022 / Consolidated, audited | Rs 50,591 cr | Rs 26.85 | n/a | n/a | Filing |
| Q3 FY22ended 31 Dec 2021 / Consolidated, audited | Rs 48,885 cr | Rs 26.41 | n/a | n/a | Filing |
| Q2 FY22ended 30 Sep 2021 / Consolidated, audited | Rs 46,867 cr | Rs 26.02 | n/a | n/a | Filing |
| Q1 FY22ended 30 Jun 2021 / Consolidated, audited | Rs 45,411 cr | Rs 24.35 | n/a | n/a | Filing |
| Q4 FY21ended 31 Mar 2021 / Consolidated, audited | Rs 43,705 cr | Rs 24.97 | n/a | n/a | Filing |
| Q3 FY21ended 31 Dec 2020 / Consolidated, audited | Rs 42,015 cr | Rs 23.19 | n/a | n/a | Filing |
| Q2 FY21ended 30 Sep 2020 / Consolidated, audited | Rs 40,135 cr | Rs 19.93 | n/a | n/a | Filing |
| Q1 FY21ended 30 Jun 2020 / Consolidated, audited | Rs 38,322 cr | Rs 18.68 | n/a | n/a | Filing |
| Q4 FY20ended 31 Mar 2020 / Consolidated, audited | Rs 39,946 cr | Rs 21.45 | n/a | n/a | Filing |
| Q3 FY20ended 31 Dec 2019 / Consolidated, audited | Rs 39,854 cr | Rs 21.63 | n/a | n/a | Filing |
| Q2 FY20ended 30 Sep 2019 / Consolidated, audited | Rs 38,977 cr | Rs 21.43 | n/a | n/a | Filing |
| Q1 FY20ended 30 Jun 2019 / Consolidated, audited | Rs 38,172 cr | Rs 21.67 | n/a | n/a | Filing |
| Q4 FY19ended 31 Mar 2019 / Consolidated, audited | Rs 38,010 cr | Rs 21.65 | n/a | n/a | Filing |
| Q3 FY19ended 31 Dec 2018 / Consolidated, audited | Rs 37,338 cr | Rs 21.60 | n/a | n/a | Filing |
| Q2 FY19ended 30 Sep 2018 / Standalone, audited | Rs 30,792 cr | Rs 19.92 | n/a | n/a | Filing |
The official financialsFiled to 31 Mar 2026
Tata Consultancy Services Ltd's statements as filed: trailing twelve month P&L, the balance sheet, and the cash engine. Parsed from official XBRL, shown in crore.
Trailing twelve months, on filed quarters
Revenue (TTM)
2,67,021 crNet profit (TTM)
49,454 crEBIT (TTM)
66,714 crProfit before tax (TTM)
65,487 crNet margin (TTM)
18.5%Finance costs (TTM)
1,227 crBalance sheet, as filed 2026-03-31
Total assets
1,82,372 crShareholder equity
1,08,478 crTotal borrowings
0.0 crCash and equivalents
6,417 crInventory
29.0 crTrade receivables
67,714 crThe cash engine, latest filed year
Operating cash flow
52,094 crCapex
4,078 crFree cash flow
48,016 crInvesting flow
-12,845 crFinancing flow
-42,133 crAnnual trail, filed year over filed year
| Year | Revenue | Net profit | Equity | Borrowings | CFO |
|---|---|---|---|---|---|
| FY26 | 2,67,021 cr | 49,454 cr | 1,08,478 cr | 0.0 cr | 52,094 cr |
| FY25 | 2,55,324 cr | 48,797 cr | 95,771 cr | 0.0 cr | 48,908 cr |
| FY24 | 2,40,893 cr | 46,099 cr | 91,319 cr | 0.0 cr | 44,338 cr |
| FY23 | 2,25,458 cr | 42,303 cr | 91,206 cr | 0.0 cr | 41,965 cr |
| FY22 | 1,91,754 cr | 38,449 cr | 89,846 cr | 0.0 cr | 39,949 cr |
| FY21 | 1,64,177 cr | 32,562 cr | 87,108 cr | 0.0 cr | n/a |
Every figure is parsed from Tata Consultancy Services Ltd's official NSE XBRL filings by the BazaarBaazi earnings lab and shown in crore rupees. Display data, not a valuation model input.
Management on record33 earnings calls
Every TCS earnings call BazaarBaazi has indexed, latest 30 Apr 2026. Read management in its own words, straight from the filed transcript.
Tata Consultancy Services Ltd earnings calls on record
33 calls since 31 Oct 2018
Show 25 older calls
Each entry links to the transcript PDF the company filed with the exchange. Primary sources, in management's own words.
What changed83 disclosures
Every recent official filing from Tata Consultancy Services Ltd, straight from the exchange feed, with the BazaarBaazi Event Heat on the disclosure flow.
Tata Consultancy Services Limited has filed 83 official disclosures recently. The most recent is a Investor meet dated 27 Jul 2026.
Press Release - TCS study reveals Physical AI is now mainstream as manufacturers scale AI implementation
Press Release - TCS and Google Cloud launch Gemini Experience Center in Kolkata
Press Release - TCS Launches Industrial AI Solutions Lab in Bengaluru Powered by NVIDIA
TCS named India s most valuable IT Services brand;7 out of 10 Indians use technology built by TCS every day
TCS Becomes Technology and Innovation Partner to New York s New Terminal One at JFK Airport
Event Heat is withheld because the reproducible what-changed window is unavailable. Every line above links to its official exchange filing, and the full market desk is at the disclosures hub.
Key fundamentalsEditorial reference
The anchor data BazaarBaazi references when reading the TCS chart. Not a substitute for a registered research note.
| Ticker | TCS |
|---|---|
| Full name | Tata Consultancy Services Ltd |
| Sector | IT services |
| Index class | LARGE CAP |
| ISIN | INE467B01029 |
| Market-cap band | ₹14.20 lakh cr |
| Last referenced level | Inside latest show |
| Last session move | -2.68% |
| Editorial line in | Closing Bell Flash on 31 Jul 2026 |
| Aliases tracked | TCS |
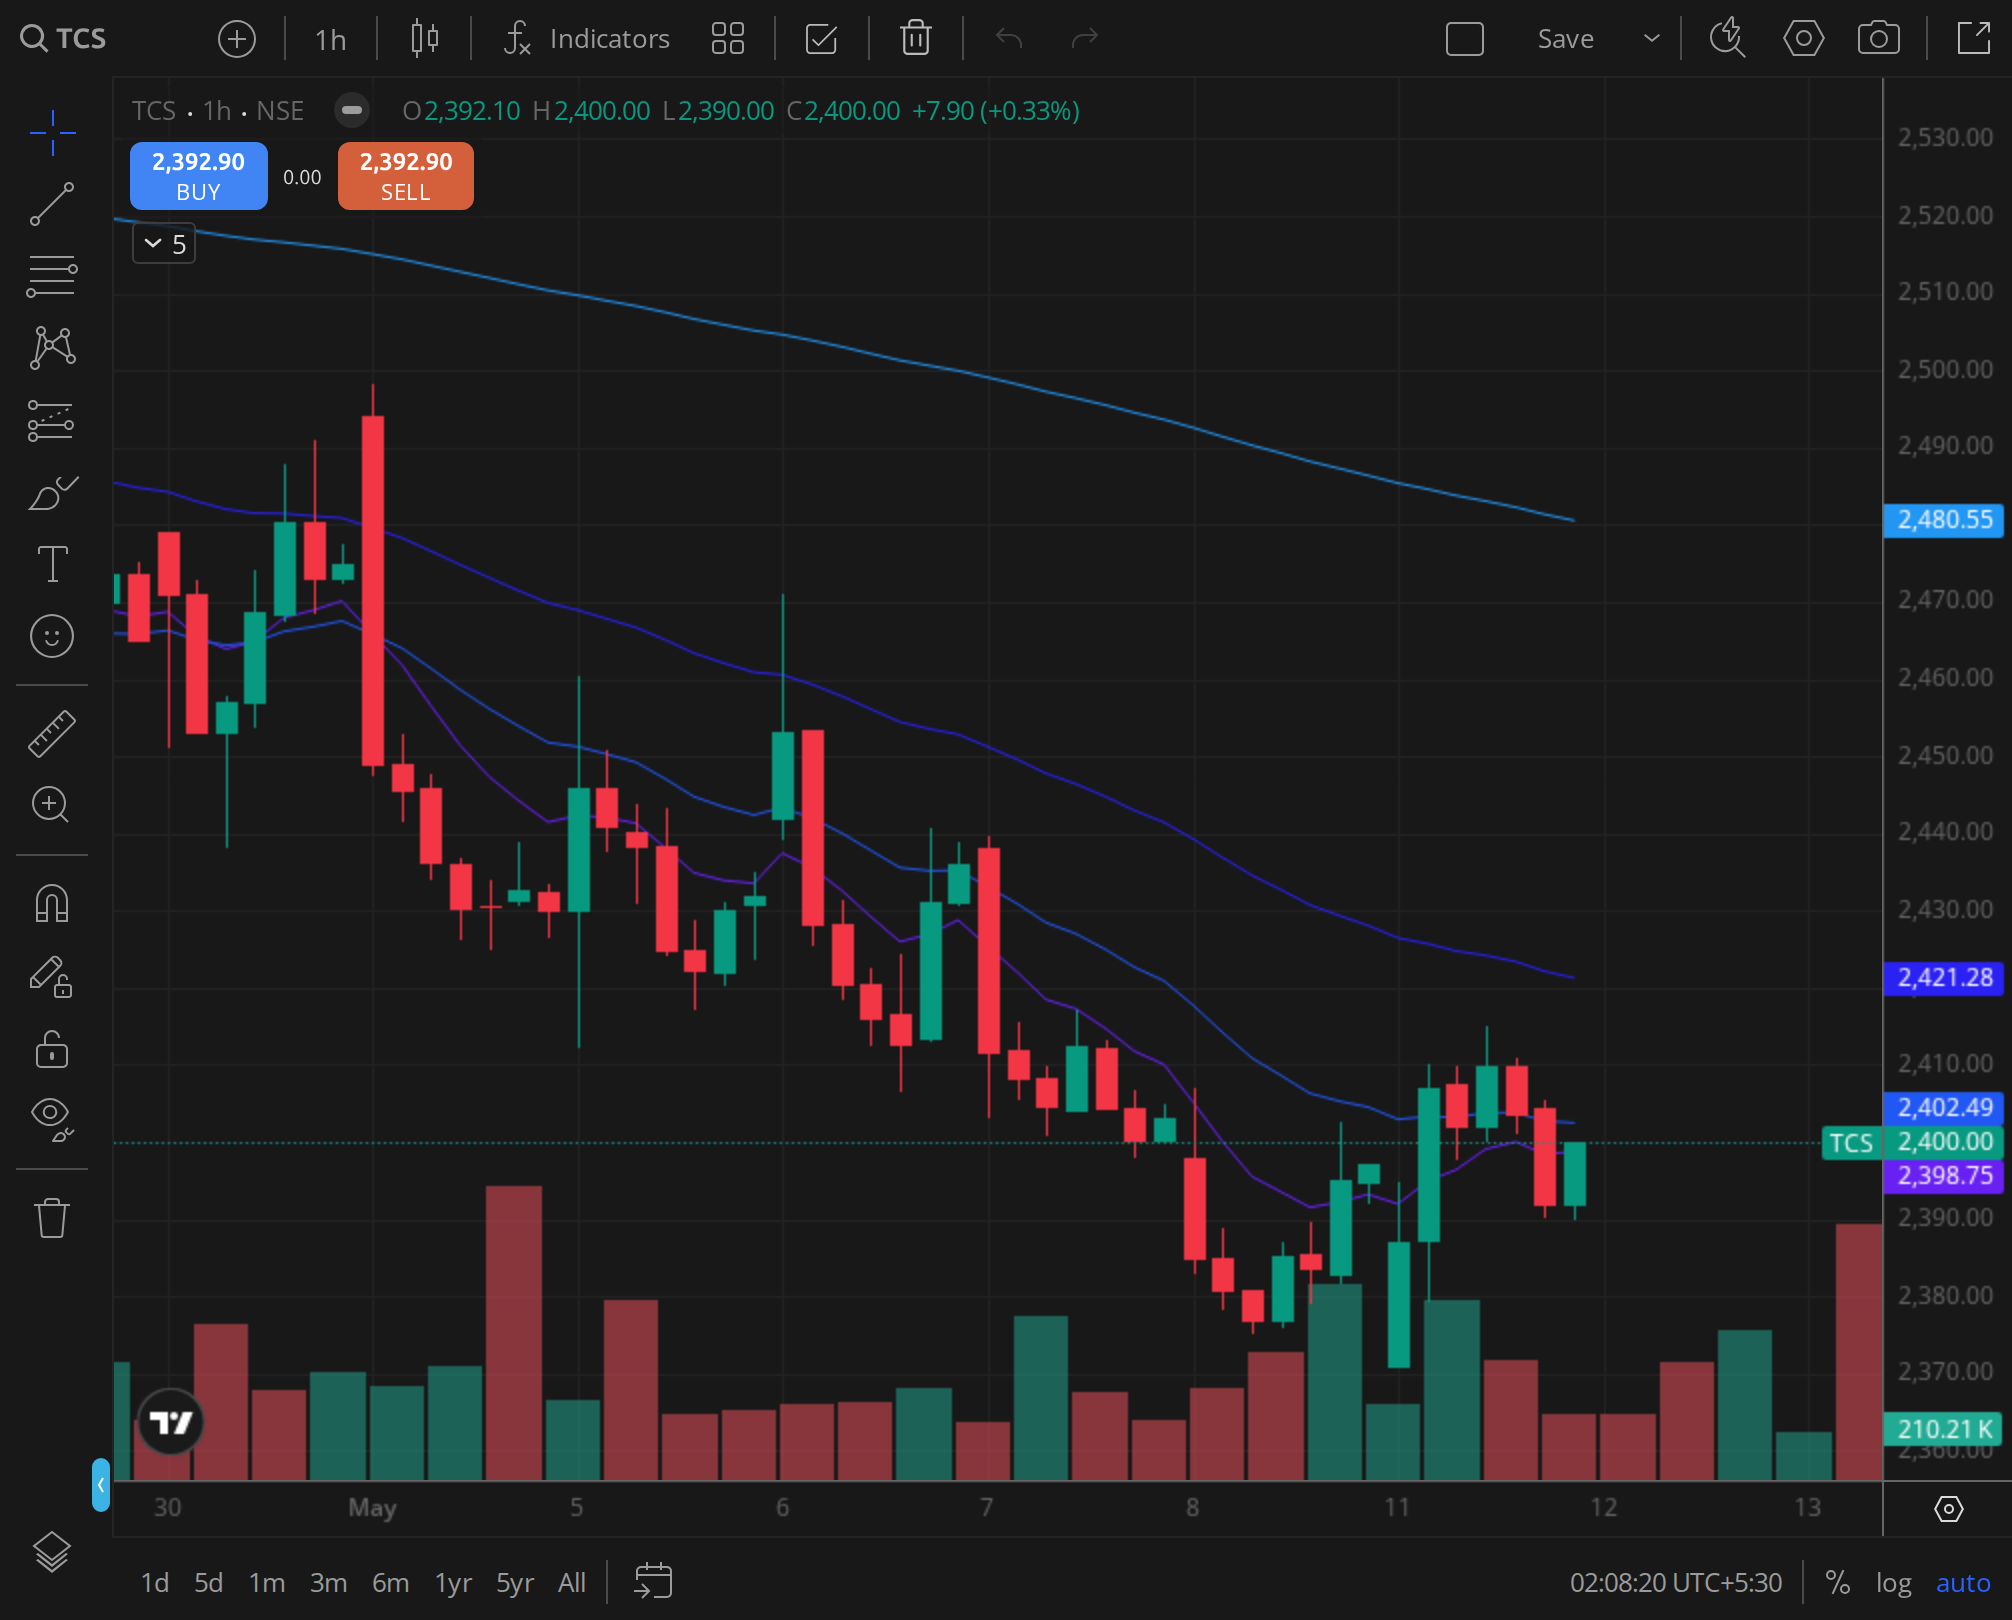
Reference chart18 Jun 2025
The daily frame the desk reads on TCS.
FAQ17 reader questions · AEO-eligible
The line on TCS, distilled and schema-marked for AI Overview, Perplexity, and reader search.
What is the TCS share price target for 2026?
BazaarBaazi does not publish a SEBI-registered price target on TCS. The desk reads structural support and resistance inside each show against the printed spot; the most recent editorial line is Closing Bell Flash on 31 Jul 2026.
What is BazaarBaazi's Crack Score for TCS?
The BazaarBaazi Crack Score for TCS is 66 out of 100 as of 31 Jul 2026, a constructive reading. It is a computed conviction number from the signed stance, how consistent the recent verdicts have been, the quality of the printed structure, and how fresh the review is. It is a transparency signal, not investment advice.
What is the F&O view on TCS?
Legacy record dated 19 Oct 2026; provider observation time unavailable, so BazaarBaazi retains TCS's dated near-money option-inventory band but withholds the specific open-interest counts, PCR and max-pain claim until a fully reproducible, provider-timestamped snapshot is recorded. Matched inventory cannot identify who initiated either side, direction, hedging, spreads or profit. This is a carried stale snapshot; the latest refresh did not replace it.
What sector is TCS in and which peers does BazaarBaazi track?
TCS sits in IT services (large cap), indicative market cap ₹14.20 lakh cr, ISIN INE467B01029. The peers BazaarBaazi reads alongside it are Infosys Ltd. Concentration not breadth. Single-stock index contribution, BFSI client mix, and the deal-TCV print that decides the IT-pack regime.
How often is the TCS view updated?
This page is one evergreen URL refreshed in place. The Crack Score and levels re-compute on every BazaarBaazi end-of-day run, and the dated stamp shows the last refresh. The latest signed verdict on TCS is neutral, published in Closing Bell Flash on 31 Jul 2026.
Is TCS a good long-term stock?
TCS is India's largest IT company and has one of the most consistent dividend and buyback records in the Indian market. The long-term case is global enterprise technology spend and TCS's ability to win the AI-transformation layer of that spend. BazaarBaazi publishes a Crack Score for current positioning.
TCS share price target 2030?
BazaarBaazi does not publish a fixed 2030 price target for TCS. Over that horizon, growth is driven by large-deal TCV conversion, AI-service monetisation, and global IT budget trends. See the dated Crack Score on the BazaarBaazi TCS page.
Why is TCS share price falling?
TCS typically de-rates when global IT spending weakens, when deal ramp delays push revenue growth below expectations, or when currency headwinds compress reported revenues. The stock also tracks broad technology sector risk-off moves in global markets. Check the current Crack Score on the BazaarBaazi page.
Is TCS a qualifying setup on the BazaarBaazi scanner right now?
On the 2026-07-31 run of the 500-name BazaarBaazi setup scanner, Tata Consultancy Services Ltd sits in the Scanned tier with a setup score of 86/100 (technical 86, fundamental 100). The scanner is a deterministic engine over real OHLCV and official filings, refreshed nightly, and it is a signal rather than investment advice.
Where can I read Tata Consultancy Services Ltd's earnings call transcripts?
BazaarBaazi indexes 33 TCS earnings calls going back to 2018-10-31, latest 2026-04-30. Every entry on this page links straight to the transcript PDF the company filed with the exchange, so you read management in the primary source.
What was Tata Consultancy Services Limited's Q1 FY27 net profit?
Tata Consultancy Services Limited reported a net profit of Rs 13,420 cr for Q1 FY27 (the quarter ended 31 March 2026). That is +4.7% year on year. The figure is from the company's official NSE filing.
What was Tata Consultancy Services Limited's Q1 FY27 revenue?
Tata Consultancy Services Limited reported revenue of Rs 72,275 cr for Q1 FY27. That is +13.9% year on year. The figure is from the company's official NSE filing.
How does BazaarBaazi rate Tata Consultancy Services Limited's Q1 FY27 result?
BazaarBaazi gives Tata Consultancy Services Limited's Q1 FY27 result a Result Pulse of 70 out of 100, with a verdict of Margin expansion. The Result Pulse is a BazaarBaazi editorial score for the quality of the filed result, not investment advice.
What has Tata Consultancy Services Ltd announced recently?
Tata Consultancy Services Ltd's two most material recent disclosures are an investor meet dated 27 Jul 2026, "Schedule of meet", and a press release dated 22 Jul 2026, "TCS study reveals Physical AI is now mainstream as…". Both link to the company's own official filing on the BazaarBaazi stock page.
Has Tata Consultancy Services Ltd declared a dividend recently?
Yes. Tata Consultancy Services Ltd filed a dividend disclosure on 15 Jul 2026, filed as "Interim Dividend - Rs 12 Per Share". Any amount shown is the exchange's own record, linked from the BazaarBaazi stock page. A dividend is a declared payout, not a forecast of future returns.
What did Tata Consultancy Services Ltd's latest board meeting cover?
Tata Consultancy Services Ltd's most recent board-meeting disclosure on record dated 09 Jul 2026 reads "Board Meeting to be held on 09-Jul-2026 to consider and approve the…". That is the agenda as filed with the exchange, linked from the BazaarBaazi stock page, and BazaarBaazi adds no claim of its own to it.
Has Tata Consultancy Services Ltd won any new orders recently?
Tata Consultancy Services Ltd filed an order-related disclosure on 09 Jul 2026, recorded with the exchange as "TCS begins FY27 with continued growth; wins multiple AI transformation deals". That is the company's own announcement as filed, linked from the BazaarBaazi stock page. It is information only, not a recommendation to act.
Related stock views
The names BazaarBaazi reads alongside TCS, each a living view refreshed every end-of-day run.