Stock · SBIN · Financial Services
SBIN share price target 2026
Support, resistance, the F&O structure and the BazaarBaazi Crack Score for State Bank of India, refreshed every end-of-day run. A systematic, data-only read on State Bank of India: where it trades versus its 50-day and 200-day lines, the live 52-week range, and momentum, refreshed from the scanner's real price series each run.
The verdict
BazaarBaazi reads SBIN as cautious with a Crack Score of 42/100 as of 21 Jul 2026.
BazaarBaaziSource & method
The scanner's readScanned · scanned 31 Jul 2026
Where SBIN stands on the 500-name BazaarBaazi setup scanner: technicals, filed fundamentals and money flow read together, refreshed every run.
Scanned and scored this run, but the evidence is incomplete or conflicted. The engine fails closed to NO_TRADE.
Technical axis
100/100Fundamental axis
50/100Money flow
57/100Result pulse · Q4 FY26
50/100Technical evidence
price above 50DMA
price above 150DMA
price above 200DMA
50 > 150 > 200 DMA (clean stack)
ATR contracting (volatility dry-up)
holding above 50DMA
above 200DMA
tight Bollinger band (0.0499)
Red flags
above 200DMA (not a confirmed short-side trend)
Relative valuation
P/E (TTM)
n/aP/E vs sector
n/aSector percentile
n/aPEG
n/aScanner levels from the deterministic engine run of 2026-07-31, not a SEBI-registered recommendation and not investment advice. The fundamental axis reads the official filing: Q4 FY26 result.
Price target: support and resistanceComputed 21 Jul 2026
Support and resistance for SBIN are read inside the latest show; no spot was printed in the most recent editorial note.
Levels are read inside the latest show. The most recent editorial reference is Closing Bell Flash on 21 Jul 2026.
These are structural reference lines, not a SEBI-registered price target. BazaarBaazi is independent media; the levels frame how the desk reads the SBIN chart, refreshed every end-of-day run.
The Crack Score, and how it is built42 / 100 · Range / mixed
The Crack Score is a deterministic 0 to 100 conviction number. Here is exactly what moved it for SBIN, so the figure is a transparent signal rather than a vibe.
Base 50, adjusted by the factors above and clamped to 0 to 100. How the Crack Score works.
About State Bank of IndiaBusiness profile
What SBIN actually does, and the edge that holds its position.
State Bank of India is less a bank than national banking infrastructure with a stock ticker attached, the lender that reaches villages no private bank will ever bother to serve. The largest bank in the country by assets, deposits, branches, and loan book, this state-owned giant carries a mandate spanning retail, corporate, agricultural, and international banking, and holds significant stakes in SBI Life Insurance, SBI Cards, SBI Mutual Fund, and SBI General Insurance. That unmatched physical network reaching remote rural geographies at a scale no private bank touches is both an operational burden and the franchise moat.
No private-sector bank can replicate SBI's government backing, sovereign deposit guarantee perception, and ability to operate in low-yield priority-sector geographies while still anchoring large corporate deals. The subsidiary portfolio adds diversified value that the market prices separately from the bank itself.
The F&O viewHorizon · 1d
How the futures and options structure on SBIN reads right now.
The editorial price read on SBIN is bearish. Strike-level option inventory is unavailable, so the page withholds writer, wall and pin claims. Single-stock F&O on SBIN can be thinner than index F&O, so the desk weights price and filed evidence over raw OI. This is not a derivatives trade recommendation.
Why it movedLatest editorial line
The most recent BazaarBaazi read on what is driving SBIN.
INDUSINDBK rose 2.53%, while HDFCBANK fell 2.07% and SBIN lost 1.51%.
Read in Closing Bell Flash on 21 Jul 2026. Why SBIN moved, the living explainer, tracks every move on one URL.
The 2026 to 2030 pictureStructural read
What genuinely drives SBIN over a multi-year horizon. A structural read, not a price forecast.
The 2026 to 2030 horizon for SBI depends on whether the dramatic asset-quality improvement of the past cycle can be sustained as the bank grows its retail and SME book. Subsidiary unlocking, particularly the SBI Cards and SBI Life listings, continues to surface value. The structural risk is that a public-sector mandate and political capital allocation pressures can force lending at terms that erode returns during economic stress. What BazaarBaazi thinks: SBI is the best-run public-sector bank by a distance and the sum of its listed subsidiaries gives the core bank a margin of safety, but it will always trade at a government discount because the majority owner is the state, and one political lending cycle can undo years of clean execution.
What to watch:
- Gross NPA and provision coverage trends across the corporate and retail book
- Net interest margin direction as RBI rate cycles evolve
- Subsidiary value: SBI Life, SBI Cards, SBI Mutual Fund
- Priority-sector lending compliance costs
- Capital adequacy and government capital-infusion patterns
Peers and how to compare4 listed names
The listed names SBIN is most often read against. Compare them on the same Crack Score and levels.
Stored valuation readStored 2026-10-19
P/E, P/B, yield and the quality set for State Bank of India, computed only from the stored fundamentals snapshot dated 2026-10-19. No carried market price is presented as current.
P / E
10.4x
Earnings yield
9.58%
P / B
1.45x
P / S
2.33x
Dividend yield
1.78%
Market cap
Rs 8.99 lakh cr
Enterprise value
Rs 6.87 lakh cr
Return on equity
13.9%
Stored from State Bank of India's filed results, as of 2026-10-19 and currency-checked. Price input Rs 973.70 from baked EOD spot. Open the calculator, move the price and watch every ratio react.
Latest filed resultsQ4 FY26
State Bank of India's most recent quarter, parsed straight from the official NSE filing. Every figure links back to its primary source.
Result Pulse
50 / 100Revenue
Not disclosed (bank basis)Net profit
Rs 20,161 crEPS (quarter)
Not disclosed| Growth | YoY | QoQ |
|---|---|---|
| Revenue | +0.8% | -2.5% |
| Net profit | +1.1% | -7.8% |
| Net margin | +11.1% | |
Figures are the Q4 FY26 result for State Bank Of India, parsed straight from the official NSE integrated filing and verified to the paisa. The EPS shown is for the quarter, not a trailing-twelve-month figure, so it is not a P/E input.
Earnings history, every filed quarter32 quarters on record
State Bank of India's official quarterly revenue, EPS and Result Pulse trail, every quarter the desk holds from the verified filings export, back to 30 Jun 2018. These are quarterly facts, not TTM valuation inputs.
SBIN official result trail
32 quarters
Quarterly figures only: revenue, net profit and EPS are copied from official filings. EPS here is not trailing twelve month EPS and is not used for valuation.
| Quarter | Revenue | EPS | PAT YoY | Pulse | Source |
|---|---|---|---|---|---|
| Q4 FY26ended 31 Mar 2026 / Consolidated, audited | Not disclosed | Not disclosed | n/a | n/a | Filing |
| Q3 FY26ended 31 Dec 2025 / Consolidated, audited | Not disclosed | Not disclosed | n/a | 50/100 | Filing |
| Q2 FY26ended 30 Sep 2025 / Consolidated, audited | Not disclosed | Not disclosed | n/a | n/a | Filing |
| Q1 FY26ended 30 Jun 2025 / Consolidated, audited | Not disclosed | Not disclosed | n/a | 50/100 | Filing |
| Q4 FY25ended 31 Mar 2025 / Consolidated, audited | Not disclosed | Not disclosed | n/a | 50/100 | Filing |
| Q3 FY25ended 31 Dec 2024 / Consolidated, audited | Not disclosed | Not disclosed | n/a | n/a | Filing |
| Q2 FY25ended 30 Sep 2024 / Consolidated, audited | Not disclosed | Not disclosed | n/a | n/a | Filing |
| Q1 FY25ended 30 Jun 2024 / Consolidated, audited | Not disclosed | Not disclosed | n/a | n/a | Filing |
| Q4 FY24ended 31 Mar 2024 / Consolidated, audited | Not disclosed | Not disclosed | n/a | n/a | Filing |
| Q3 FY24ended 31 Dec 2023 / Consolidated, audited | Not disclosed | Not disclosed | n/a | n/a | Filing |
| Q2 FY24ended 30 Sep 2023 / Consolidated, audited | Not disclosed | Not disclosed | n/a | n/a | Filing |
| Q1 FY24ended 30 Jun 2023 / Consolidated, audited | Not disclosed | Not disclosed | n/a | n/a | Filing |
| Q4 FY23ended 31 Mar 2023 / Consolidated, audited | Not disclosed | Not disclosed | n/a | n/a | Filing |
| Q3 FY23ended 31 Dec 2022 / Consolidated, audited | Not disclosed | Not disclosed | n/a | n/a | Filing |
| Q2 FY23ended 30 Sep 2022 / Consolidated, audited | Not disclosed | Not disclosed | n/a | n/a | Filing |
| Q1 FY23ended 30 Jun 2022 / Consolidated, audited | Not disclosed | Not disclosed | n/a | n/a | Filing |
| Q4 FY22ended 31 Mar 2022 / Consolidated, audited | Not disclosed | Not disclosed | n/a | n/a | Filing |
| Q3 FY22ended 31 Dec 2021 / Consolidated, audited | Not disclosed | Not disclosed | n/a | n/a | Filing |
| Q2 FY22ended 30 Sep 2021 / Consolidated, audited | Not disclosed | Not disclosed | n/a | n/a | Filing |
| Q1 FY22ended 30 Jun 2021 / Consolidated, audited | Not disclosed | Not disclosed | n/a | n/a | Filing |
| Q4 FY21ended 31 Mar 2021 / Consolidated, audited | Not disclosed | Not disclosed | n/a | n/a | Filing |
| Q3 FY21ended 31 Dec 2020 / Standalone, audited | Not disclosed | Not disclosed | n/a | n/a | Filing |
| Q2 FY21ended 30 Sep 2020 / Standalone, audited | Not disclosed | Not disclosed | n/a | n/a | Filing |
| Q1 FY21ended 30 Jun 2020 / Standalone, audited | Not disclosed | Not disclosed | n/a | n/a | Filing |
| Q4 FY20ended 31 Mar 2020 / Standalone, audited | Not disclosed | Not disclosed | n/a | n/a | Filing |
| Q3 FY20ended 31 Dec 2019 / Standalone, audited | Not disclosed | Not disclosed | n/a | n/a | Filing |
| Q2 FY20ended 30 Sep 2019 / Standalone, audited | Not disclosed | Not disclosed | n/a | n/a | Filing |
| Q1 FY20ended 30 Jun 2019 / Standalone, audited | Not disclosed | Not disclosed | n/a | n/a | Filing |
| Q4 FY19ended 31 Mar 2019 / Standalone, audited | Not disclosed | Not disclosed | n/a | n/a | Filing |
| Q3 FY19ended 31 Dec 2018 / Standalone, audited | Not disclosed | Not disclosed | n/a | n/a | Filing |
| Q2 FY19ended 30 Sep 2018 / Standalone, audited | Not disclosed | Not disclosed | n/a | n/a | Filing |
| Q1 FY19ended 30 Jun 2018 / Standalone, audited | Not disclosed | Not disclosed | n/a | n/a | Filing |
The official financialsFiled to 31 Mar 2026
State Bank of India's statements as filed: trailing twelve month P&L, the balance sheet, and the cash engine, in the bank-and-NBFC native view. Parsed from official XBRL, shown in crore.
Trailing twelve months, on filed quarters
Total income (TTM)
7,09,617 crNet profit (TTM)
85,168 crProfit before tax (TTM)
1,14,028 crFinance costs (TTM)
3,15,005 crBalance sheet, as filed 2026-03-31
Total assets
83,21,569 crShareholder equity
6,14,899 crTotal borrowings
n/aAdvances (loan book)
49,78,013 crDeposits
60,43,097 crGross NPA
0.0 crNet NPA
0.0 crAnnual trail, filed year over filed year
| Year | Total income | Net profit | Equity | Borrowings |
|---|---|---|---|---|
| FY26 | 7,09,617 cr | 85,168 cr | 6,14,899 cr | n/a |
| FY24 | 5,94,575 cr | 68,138 cr | 4,30,557 cr | n/a |
| FY23 | 4,73,378 cr | 56,558 cr | 3,71,768 cr | n/a |
| FY22 | 4,06,973 cr | 36,356 cr | 3,05,588 cr | n/a |
| FY21 | 3,83,971 cr | 22,405 cr | n/a | n/a |
Every figure is parsed from State Bank of India's official NSE XBRL filings by the BazaarBaazi earnings lab and shown in crore rupees. Display data, not a valuation model input.
Management on record20 earnings calls
Every SBIN earnings call BazaarBaazi has indexed, latest 31 May 2026. Read management in its own words, straight from the filed transcript.
State Bank of India earnings calls on record
20 calls since 31 Dec 2020
Show 12 older calls
Each entry links to the transcript PDF the company filed with the exchange. Primary sources, in management's own words.
What changed108 disclosures
Every recent official filing from State Bank of India, straight from the exchange feed, with the BazaarBaazi Event Heat on the disclosure flow.
State Bank of India has filed 108 official disclosures recently. The most recent is a Disclosure dated 31 Jul 2026.
a press release dated July 29, 2026, titled "Press Release: Issuance of Additional Tier 1 Bonds
Interaction with Analysts / Institutional Investors on 07.08.2026
a press release dated July 21, 2026, titled "Listing of SBI Funds Management Limited
Event Heat is withheld because the reproducible what-changed window is unavailable. Every line above links to its official exchange filing, and the full market desk is at the disclosures hub.
Key fundamentalsEditorial reference
The anchor data BazaarBaazi references when reading the SBIN chart. Not a substitute for a registered research note.
| Ticker | SBIN |
|---|---|
| Full name | State Bank of India |
| Sector | Financial Services |
| Index class | MID CAP |
| ISIN | INE062A01020 |
| Market-cap band | |
| Last referenced level | Inside latest show |
| Last session move | Not referenced this cycle |
| Editorial line in | Closing Bell Flash on 21 Jul 2026 |
| Aliases tracked | SBIN |
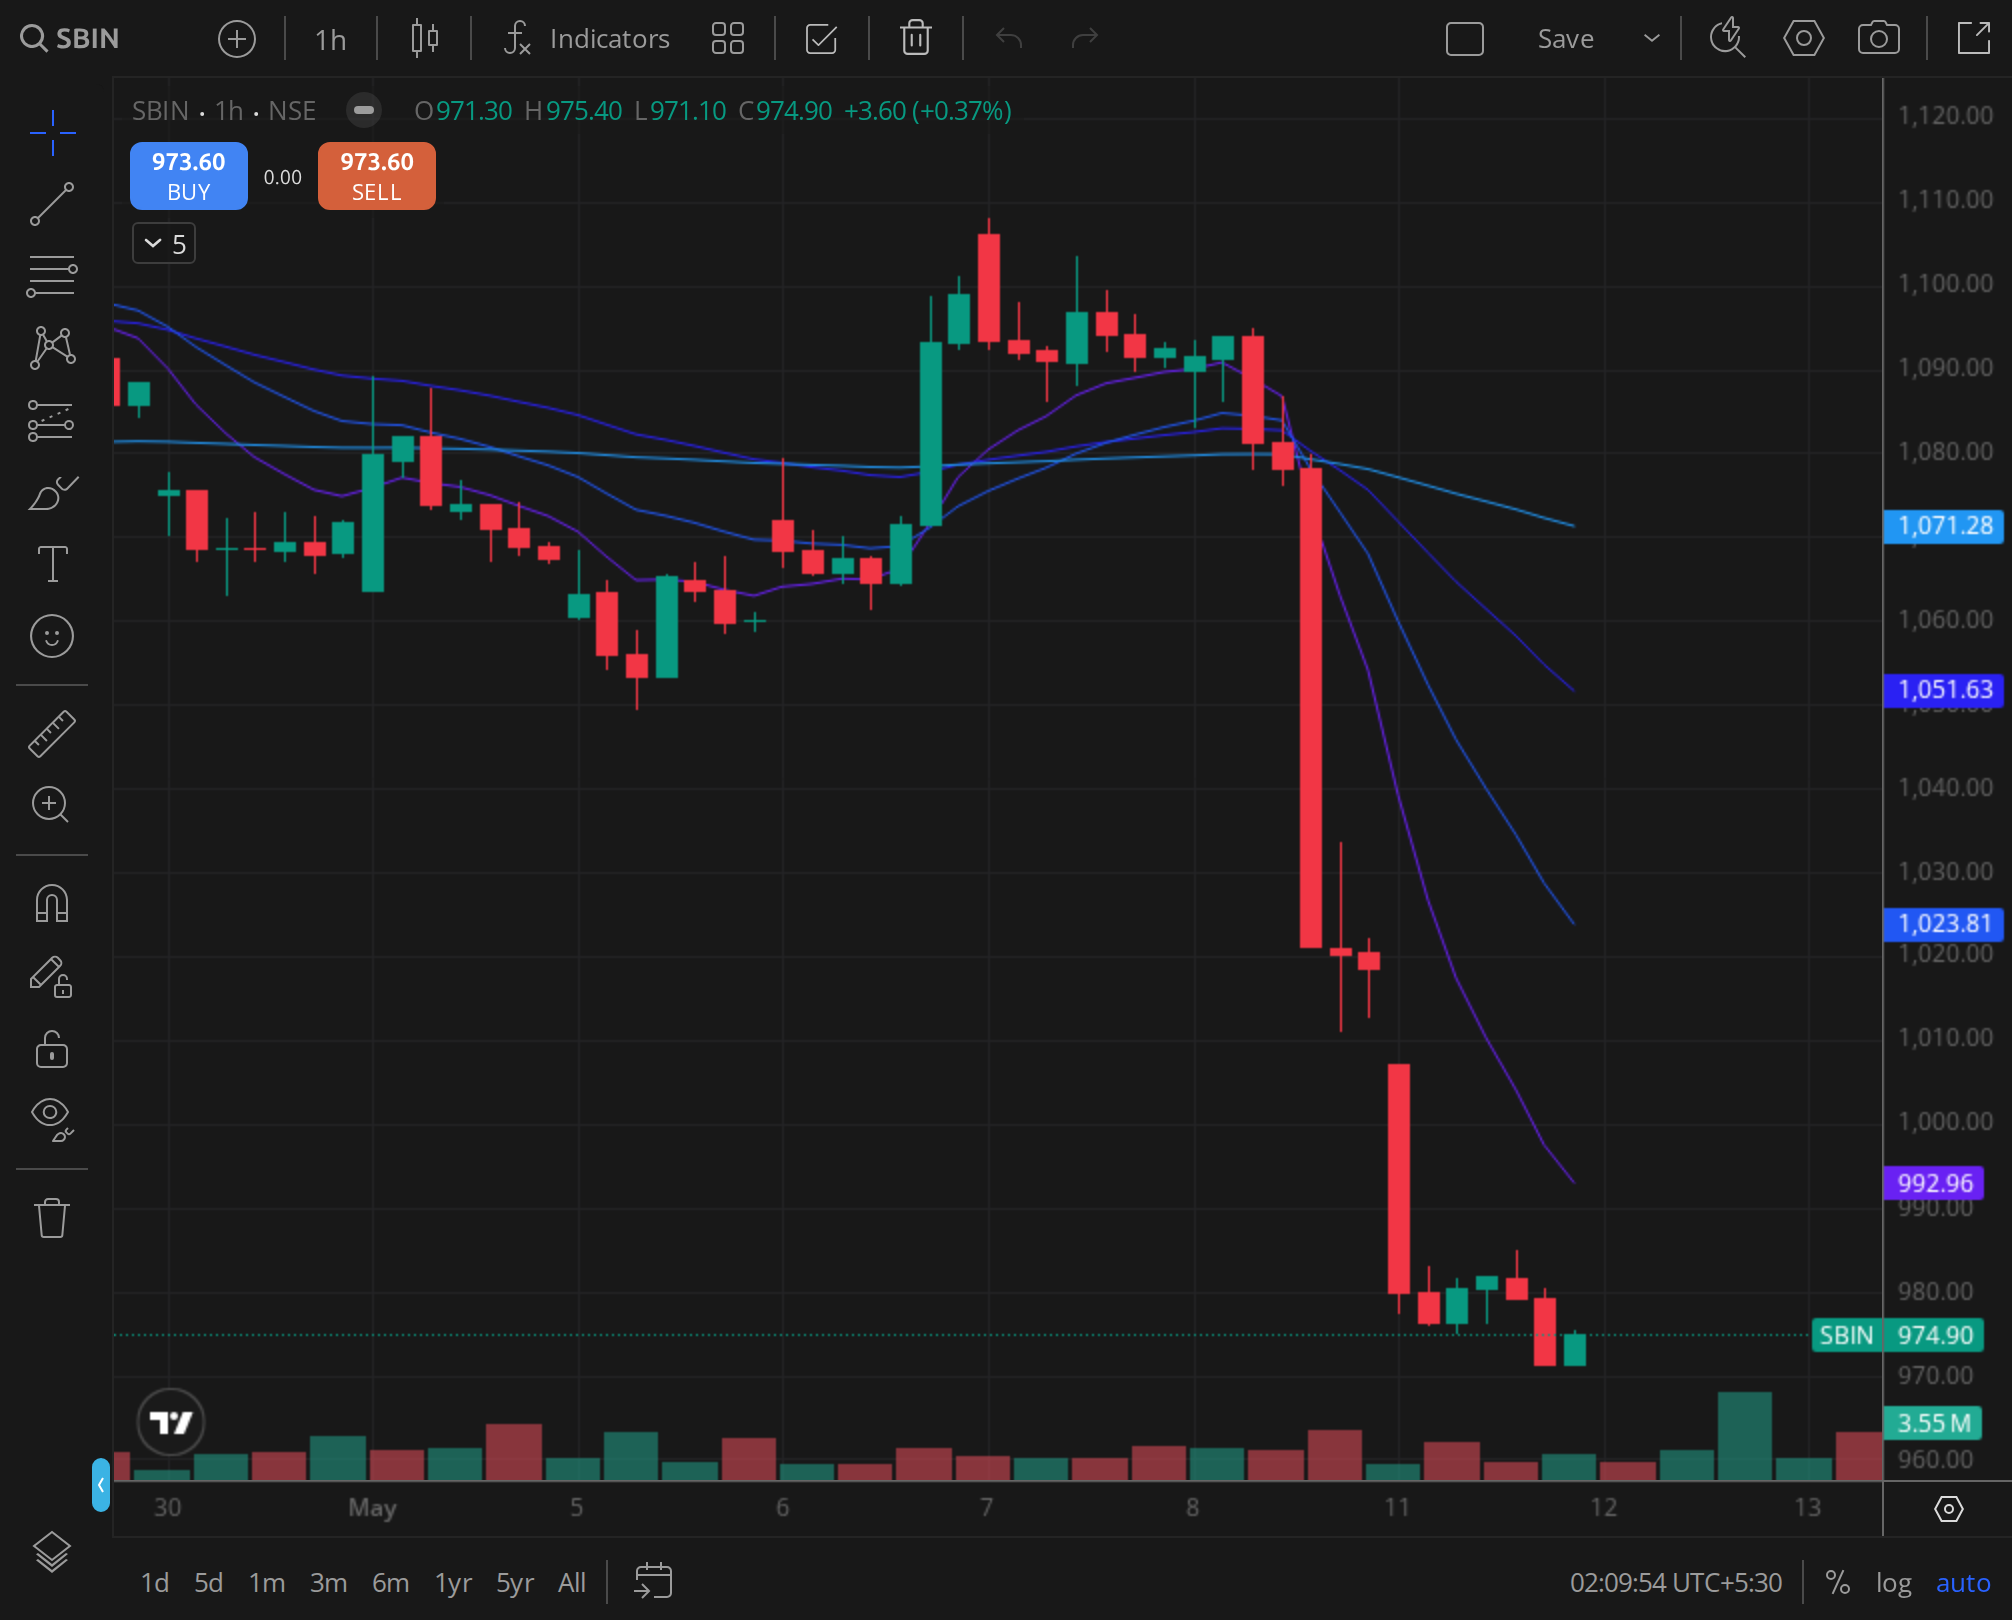
Reference chart9 Dec 2024
The daily frame the desk reads on SBIN.
FAQ17 reader questions · AEO-eligible
The line on SBIN, distilled and schema-marked for AI Overview, Perplexity, and reader search.
What is the SBIN share price target for 2026?
BazaarBaazi does not publish a SEBI-registered price target on SBIN. The desk reads structural support and resistance inside each show against the printed spot; the most recent editorial line is Closing Bell Flash on 21 Jul 2026.
What is BazaarBaazi's Crack Score for SBIN?
The BazaarBaazi Crack Score for SBIN is 42 out of 100 as of 21 Jul 2026, a range / mixed reading. It is a computed conviction number from the signed stance, how consistent the recent verdicts have been, the quality of the printed structure, and how fresh the review is. It is a transparency signal, not investment advice.
What is the F&O view on SBIN?
Strike-level option inventory for SBIN is unavailable, so BazaarBaazi withholds participant, direction and positioning claims. The editorial chart stance is not substituted for an option-chain observation.
What sector is SBIN in and which peers does BazaarBaazi track?
SBIN sits in Financial Services (mid cap), indicative market cap , ISIN INE062A01020. The peers BazaarBaazi reads alongside it are Karur Vysya Bank Ltd, ANAND RATHI WEALTH LIMITED, CHOICE INTERNATIONAL LIMITED. A systematic, data-only read on State Bank of India: where it trades versus its 50-day and 200-day lines, the live 52-week range, and momentum, refreshed from the scanner's real price series each run.
How often is the SBIN view updated?
This page is one evergreen URL refreshed in place. The Crack Score and levels re-compute on every BazaarBaazi end-of-day run, and the dated stamp shows the last refresh. The latest signed verdict on SBIN is bearish, published in Closing Bell Flash on 21 Jul 2026.
Is SBI a good long-term stock?
What drives SBI is sustained asset-quality improvement plus the steady unlocking of subsidiary value from SBI Cards, SBI Life and the rest, and the risk the Crack Score cannot capture is the one thing no model prices cleanly: government-directed lending that can be switched on during economic stress. The long-term case rests on credit growth and subsidiary value realisation, tempered by the political and mandate risks private peers do not carry. BazaarBaazi publishes a Crack Score for current positioning.
SBI share price target 2030?
Pinning a 2030 number on a bank the government can steer is naive; the real drivers are NPA trajectory, capital allocation discipline, and the unlocking of subsidiary value via listings or dividends. BazaarBaazi does not publish a fixed 2030 price target for SBIN. See the dated Crack Score on the BazaarBaazi SBIN page.
Why is SBI share price falling?
SBIN slides when the market prices in asset-quality deterioration, rate-cycle margin pressure, or the recurring fear that government-directed lending will hurt returns, and as the bellwether public-sector bank it also wears the whole sector's mood and every global risk-off move. Check the current Crack Score on the BazaarBaazi SBIN page.
Is SBIN a qualifying setup on the BazaarBaazi scanner right now?
On the 2026-07-31 run of the 500-name BazaarBaazi setup scanner, State Bank of India sits in the Scanned tier with a setup score of 73/100 (technical 100, fundamental 50). The scanner is a deterministic engine over real OHLCV and official filings, refreshed nightly, and it is a signal rather than investment advice.
Where can I read State Bank of India's earnings call transcripts?
BazaarBaazi indexes 20 SBIN earnings calls going back to 2020-12-31, latest 2026-05-31. Every entry on this page links straight to the transcript PDF the company filed with the exchange, so you read management in the primary source.
What was State Bank Of India's Q4 FY26 net profit?
State Bank Of India reported a net profit of Rs 20,161 cr for Q4 FY26 (the quarter ended 31 March 2026). That is +1.1% year on year. The figure is from the company's official NSE filing.
Why is State Bank Of India's Q4 FY26 revenue not shown?
State Bank Of India files on a bank basis, which does not report a single comparable revenue line, so BazaarBaazi reads the Q4 FY26 result off net profit rather than printing a misleading revenue figure. The figure is from the company's official NSE filing.
How does BazaarBaazi rate State Bank Of India's Q4 FY26 result?
BazaarBaazi gives State Bank Of India's Q4 FY26 result a Result Pulse of 50 out of 100, with a verdict of Mixed. The Result Pulse is a BazaarBaazi editorial score for the quality of the filed result, not investment advice.
What has State Bank of India announced recently?
State Bank of India's two most material recent disclosures are a disclosure dated 31 Jul 2026, "change in Senior Management", and a press release dated 29 Jul 2026, "Updates regarding bidding for Additional Tier 1 Bonds". Both link to the company's own official filing on the BazaarBaazi stock page.
Has State Bank of India declared a dividend recently?
Yes. State Bank of India filed a dividend disclosure on 15 May 2026, filed as "Dividend - Rs 17.35 Per Share". Any amount shown is the exchange's own record, linked from the BazaarBaazi stock page. A dividend is a declared payout, not a forecast of future returns.
What did State Bank of India's latest board meeting cover?
State Bank of India's most recent board-meeting disclosure on record dated 18 Jun 2026 reads "Board Meeting to be held on 18-Jun-2026 to consider Fund raising". That is the agenda as filed with the exchange, linked from the BazaarBaazi stock page, and BazaarBaazi adds no claim of its own to it.
Has State Bank of India's credit rating been updated recently?
State Bank of India filed a credit-rating disclosure on 24 Jul 2026, recorded with the exchange as "Credit Rating- New". The detail sits in the linked filing on the BazaarBaazi stock page. A rating action is an agency view on debt, separate from the share price.
Related stock views
The names BazaarBaazi reads alongside SBIN, each a living view refreshed every end-of-day run.
Hub
All stock views
The full BazaarBaazi coverage universe, scored and dated.
Financial Services
KARURVYSYA
Karur Vysya Bank Ltd
Financial Services
ANANDRATHI
ANAND RATHI WEALTH LIMITED
Financial Services
CHOICEIN
CHOICE INTERNATIONAL LIMITED
Financial Services
360ONE
360 ONE WAM LIMITED
Financial Services
AADHARHFC
Aadhar Housing Finance Limited