Stock · NESTLEIND · Fast Moving Consumer Goods
NESTLEIND share price target 2026
Support, resistance, the F&O structure and the BazaarBaazi Crack Score for NESTLE INDIA LIMITED, refreshed every end-of-day run. A systematic, data-only read on NESTLE INDIA LIMITED: where it trades versus its 50-day and 200-day lines, the live 52-week range, and momentum, refreshed from the scanner's real price series each run.
The verdict
BazaarBaazi reads NESTLEIND as constructive with a Crack Score of 82/100 as of 21 Jul 2026.
BazaarBaaziSource & method
The scanner's readScanned · scanned 31 Jul 2026
Where NESTLEIND stands on the 500-name BazaarBaazi setup scanner: technicals, filed fundamentals and money flow read together, refreshed every run.
Scanned and scored this run, but the evidence is incomplete or conflicted. The engine fails closed to NO_TRADE.
Technical axis
100/100Fundamental axis
100/100Money flow
54/100Result pulse · Q4 FY26
100/100Technical evidence
price above 50DMA
price above 150DMA
price above 200DMA
50 > 150 > 200 DMA (clean stack)
at/near 52w high (<=3% off)
RSI 63.9 (strong)
above a rising MA frame
not over-extended (<5 ATR over 50DMA)
Red flags
above 200DMA (not a confirmed short-side trend)
profit growth strong (+27.18% YoY)
strong filed result (score 100.0)
Relative valuation
P/E (TTM)
70.2P/E vs sector
+1.7%Sector percentile
82PEG
2.58Scanner levels from the deterministic engine run of 2026-07-31, not a SEBI-registered recommendation and not investment advice. The fundamental axis reads the official filing: Q4 FY26 result.
Price target: support and resistanceComputed 21 Jul 2026
Support and resistance for NESTLEIND are read inside the latest show; no spot was printed in the most recent editorial note.
Levels are read inside the latest show. The most recent editorial reference is Systematic Read on 21 Jul 2026.
These are structural reference lines, not a SEBI-registered price target. BazaarBaazi is independent media; the levels frame how the desk reads the NESTLEIND chart, refreshed every end-of-day run.
The Crack Score, and how it is built82 / 100 · High conviction
The Crack Score is a deterministic 0 to 100 conviction number. Here is exactly what moved it for NESTLEIND, so the figure is a transparent signal rather than a vibe.
Base 50, adjusted by the factors above and clamped to 0 to 100. How the Crack Score works.
About NESTLE INDIA LIMITEDBusiness profile
What NESTLEIND actually does, and the edge that holds its position.
Nestle India is, to a striking degree, a bet on a single yellow packet, and Maggi's grip on the Indian kitchen is the whole reason the stock commands its premium. A subsidiary of Nestle SA, it runs across noodles, chocolates, confectionery, beverages and dairy, but Maggi is the flagship and dominant revenue contributor with a near-defining hold on instant noodles. KitKat, Munch, Milkmaid, Nescafe and Milo fill out the shelf, yet the concentration on one beloved brand is both the comfort and the catch.
Nestle India's moat rests on the Maggi brand's near-monopoly-level loyalty in the instant-noodle category, reinforced by the trust rebuilt after the 2015 crisis that paradoxically deepened brand attachment among loyal consumers. Global parent support in product development, quality standards and brand investment gives it resources that purely domestic food players lack.
The F&O viewHorizon · swing
How the futures and options structure on NESTLEIND reads right now.
The editorial price read on NESTLEIND is bullish. Strike-level option inventory is unavailable, so the page withholds writer, wall and pin claims. Single-stock F&O on NESTLEIND can be thinner than index F&O, so the desk weights price and filed evidence over raw OI. This is not a derivatives trade recommendation.
Why it movedLatest editorial line
The most recent BazaarBaazi read on what is driving NESTLEIND.
Systematic read: a disclosed, data-only model on real 1-year price structure.
Read in Systematic Read on 21 Jul 2026. Why NESTLEIND moved, the living explainer, tracks every move on one URL.
The 2026 to 2030 pictureStructural read
What genuinely drives NESTLEIND over a multi-year horizon. A structural read, not a price forecast.
Between 2026 and 2030, the growth drivers are portfolio extension into health nutrition and premium dairy, urban premiumisation trends lifting average selling prices, and rural distribution deepening to capture first-time Maggi and KitKat buyers. The key risk is commodity cost volatility in wheat, milk and cocoa intersecting with the company's limited ability to pass through price increases in a market where perceived value is tightly anchored. What BazaarBaazi thinks: the brand loyalty is exceptional and the pricing power real, but the squeeze no score captures is that a packet whose value is fixed in the consumer's mind cannot easily raise prices when wheat and cocoa spike, so the margin takes the hit the brand will not let the price take.
What to watch:
- Maggi volume growth quarter on quarter as the lead product-health indicator
- Rural distribution reach expansion through Project Vijay and similar programmes
- Gross margin trend as wheat and milk costs fluctuate
- New category launches in nutrition and health (Milo variants, fortified products)
- Quick-commerce and e-grocery channel contribution to total sales
Peers and how to compare4 listed names
The listed names NESTLEIND is most often read against. Compare them on the same Crack Score and levels.
Stored valuation readStored 2026-10-19
P/E, P/B, yield and the quality set for NESTLE INDIA LIMITED, computed only from the stored fundamentals snapshot dated 2026-10-19. No carried market price is presented as current.
P / E
58.8x
Earnings yield
1.70%
P / B
41.45x
P / S
9.38x
EV / EBITDA
39.8x
Dividend yield
0.97%
Market cap
Rs 2.40 lakh cr
Enterprise value
Rs 2.38 lakh cr
Stored from NESTLE INDIA LIMITED's filed results, as of 2026-10-19 and currency-checked. Price input Rs 1,242.70 from baked EOD spot. Open the calculator, move the price and watch every ratio react.
Latest filed resultsQ4 FY26
NESTLE INDIA LIMITED's most recent quarter, parsed straight from the official NSE filing. Every figure links back to its primary source.
Result Pulse
100 / 100Revenue
Rs 6,748 crNet profit
Rs 1,111 crEPS (quarter)
Rs 5.76| Growth | YoY | QoQ |
|---|---|---|
| Revenue | +22.6% | +19.1% |
| Net profit | +27.2% | +11.3% |
| Net margin | +16.5% | |
Figures are the Q4 FY26 result for NESTLE INDIA LIMITED, parsed straight from the official NSE integrated filing and verified to the paisa. The EPS shown is for the quarter, not a trailing-twelve-month figure, so it is not a P/E input.
Earnings history, every filed quarter32 quarters on record
NESTLE INDIA LIMITED's official quarterly revenue, EPS and Result Pulse trail, every quarter the desk holds from the verified filings export, back to 30 Jun 2018. These are quarterly facts, not TTM valuation inputs.
NESTLEIND official result trail
32 quarters
Quarterly figures only: revenue, net profit and EPS are copied from official filings. EPS here is not trailing twelve month EPS and is not used for valuation.
| Quarter | Revenue | EPS | PAT YoY | Pulse | Source |
|---|---|---|---|---|---|
| Q4 FY26ended 31 Mar 2026 / Consolidated, audited | Rs 6,748 cr | Rs 5.76 | n/a | n/a | Filing |
| Q3 FY26ended 31 Dec 2025 / Consolidated, audited | Rs 5,667 cr | Rs 5.17 | n/a | 68/100 | Filing |
| Q2 FY26ended 30 Sep 2025 / Consolidated, audited | Rs 5,644 cr | Rs 3.86 | n/a | n/a | Filing |
| Q1 FY26ended 30 Jun 2025 / Consolidated, audited | Rs 5,096 cr | Rs 6.71 | n/a | 50/100 | Filing |
| Q4 FY25ended 31 Mar 2025 / Consolidated, audited | Rs 5,504 cr | Rs 9.06 | n/a | 58/100 | Filing |
| Q3 FY25ended 31 Dec 2024 / Consolidated, audited | Rs 4,780 cr | Rs 7.14 | n/a | n/a | Filing |
| Q2 FY25ended 30 Sep 2024 / Consolidated, audited | Rs 5,104 cr | Rs 9.33 | n/a | n/a | Filing |
| Q1 FY25ended 30 Jun 2024 / Standalone, audited | Rs 4,814 cr | Rs 7.74 | n/a | n/a | Filing |
| Q4 FY24ended 31 Mar 2024 / Standalone, audited | Rs 5,268 cr | Rs 9.69 | n/a | n/a | Filing |
| Q3 FY24ended 31 Dec 2023 / Standalone, audited | Rs 4,600 cr | Rs 6.80 | n/a | n/a | Filing |
| Q2 FY24ended 30 Sep 2023 / Standalone, audited | Rs 5,037 cr | Rs 94.18 | n/a | n/a | Filing |
| Q1 FY24ended 30 Jun 2023 / Standalone, audited | Rs 4,659 cr | Rs 72.43 | n/a | n/a | Filing |
| Q4 FY23ended 31 Mar 2023 / Standalone, audited | Rs 4,831 cr | Rs 76.40 | n/a | n/a | Filing |
| Q3 FY23ended 31 Dec 2022 / Standalone, audited | Rs 4,257 cr | Rs 65.14 | n/a | n/a | Filing |
| Q2 FY23ended 30 Sep 2022 / Standalone, audited | Rs 4,591 cr | Rs 69.32 | n/a | n/a | Filing |
| Q1 FY23ended 30 Jun 2022 / Standalone, audited | Rs 4,037 cr | Rs 53.45 | n/a | n/a | Filing |
| Q4 FY22ended 31 Mar 2022 / Standalone, audited | Rs 3,981 cr | Rs 61.68 | n/a | n/a | Filing |
| Q3 FY22ended 31 Dec 2021 / Standalone, audited | Rs 3,739 cr | Rs 40.10 | n/a | n/a | Filing |
| Q2 FY22ended 30 Sep 2021 / Standalone, audited | Rs 3,883 cr | Rs 64.04 | n/a | n/a | Filing |
| Q1 FY22ended 30 Jun 2021 / Standalone, audited | Rs 3,477 cr | Rs 55.86 | n/a | n/a | Filing |
| Q4 FY21ended 31 Mar 2021 / Standalone, audited | Rs 3,611 cr | Rs 62.46 | n/a | n/a | Filing |
| Q3 FY21ended 31 Dec 2020 / Standalone, audited | Rs 3,433 cr | Rs 50.12 | n/a | n/a | Filing |
| Q2 FY21ended 30 Sep 2020 / Standalone, audited | Rs 3,542 cr | Rs 60.89 | n/a | n/a | Filing |
| Q1 FY21ended 30 Jun 2020 / Standalone, audited | Rs 3,050 cr | Rs 50.47 | n/a | n/a | Filing |
| Q4 FY20ended 31 Mar 2020 / Standalone, audited | Rs 3,325 cr | Rs 54.50 | n/a | n/a | Filing |
| Q3 FY20ended 31 Dec 2019 / Standalone, audited | Rs 3,149 cr | Rs 49.06 | n/a | n/a | Filing |
| Q2 FY20ended 30 Sep 2019 / Standalone, audited | Rs 3,216 cr | Rs 61.76 | n/a | n/a | Filing |
| Q1 FY20ended 30 Jun 2019 / Standalone, audited | Rs 3,001 cr | Rs 45.41 | n/a | n/a | Filing |
| Q4 FY19ended 31 Mar 2019 / Standalone, audited | Rs 3,003 cr | Rs 48.05 | n/a | n/a | Filing |
| Q3 FY19ended 31 Dec 2018 / Standalone, audited | Rs 11,292 cr | Rs 166.67 | n/a | n/a | Filing |
| Q2 FY19ended 30 Sep 2018 / Standalone, audited | Rs 2,939 cr | Rs 46.27 | n/a | n/a | Filing |
| Q1 FY19ended 30 Jun 2018 / Standalone, audited | Rs 2,698 cr | Rs 40.97 | n/a | n/a | Filing |
The official financialsFiled to 31 Mar 2026
NESTLE INDIA LIMITED's statements as filed: trailing twelve month P&L, the balance sheet, and the cash engine. Parsed from official XBRL, shown in crore.
Trailing twelve months, on filed quarters
Revenue (TTM)
23,155 crNet profit (TTM)
3,499 crEBIT (TTM)
4,768 crProfit before tax (TTM)
4,610 crNet margin (TTM)
15.1%Finance costs (TTM)
158 crBalance sheet, as filed 2026-03-31
Total assets
13,182 crShareholder equity
5,157 crTotal borrowings
24.4 crCash and equivalents
1,321 crInventory
2,569 crTrade receivables
329 crThe cash engine, latest filed year
Operating cash flow
5,048 crCapex
830 crFree cash flow
4,218 crInvesting flow
-624 crFinancing flow
-3,179 crAnnual trail, filed year over filed year
| Year | Revenue | Net profit | Equity | Borrowings | CFO |
|---|---|---|---|---|---|
| FY26 | 23,155 cr | 3,499 cr | 5,157 cr | 24.4 cr | 5,048 cr |
| FY25 | 20,202 cr | 3,208 cr | 4,010 cr | 753 cr | 2,936 cr |
Every figure is parsed from NESTLE INDIA LIMITED's official NSE XBRL filings by the BazaarBaazi earnings lab and shown in crore rupees. Display data, not a valuation model input.
Management on record4 earnings calls
Every NESTLEIND earnings call BazaarBaazi has indexed, latest 28 Feb 2025. Read management in its own words, straight from the filed transcript.
NESTLE INDIA LIMITED earnings calls on record
4 calls since 31 Aug 2022
Each entry links to the transcript PDF the company filed with the exchange. Primary sources, in management's own words.
What changed64 disclosures
Every recent official filing from NESTLE INDIA LIMITED, straight from the exchange feed, with the BazaarBaazi Event Heat on the disclosure flow.
NESTLE INDIA LIMITED has filed 64 official disclosures recently. The most recent is a AGM / EGM dated 30 Jul 2026.
Nestle India Limited has informed the Exchange with copy of detailed proceedings of the 67th Annual General Meeting ( 67th AGM ) of the Company held on Friday, 3rd July 2026
Newspaper advertisement Public Notice regarding loss of share certificate(s)
the Intimation of an analyst/ institutional investors meet (virtual) schedule for 4th August 2026 at 2PM (IST)
Nestle India Limited has submitted to the Exchange, the Unaudited Financial Results (standalone and consolidated) for the first quarter ended 30th June 2026
Board Meeting to be held on 22-Jul-2026 to inter-alia consider and approve the Unaudited Financial results of the Company for the Quarterly ended June 2026
A meeting of the Board of Directors of the Company is scheduled for Wednesday, 22nd July 2026, to inter-alia consider the unaudited financial results (standalone and consolidated) for the first quarter ending 30th June 2026.
a press release dated July 22, 2026, titled "Nestlé India delivered robust 25.4% sales growth led by strong volume growth - All four product groups recorded strong double-digit growth
Nestle India Limited has informed the Exchange Intimation regarding receipt of an Order from Superintendent of Taxes Charge-IV, Agartala Kar Bhavan, Palace Compound, West Tripura District, Tripura
Event Heat is withheld because the reproducible what-changed window is unavailable. Every line above links to its official exchange filing, and the full market desk is at the disclosures hub.
Key fundamentalsEditorial reference
The anchor data BazaarBaazi references when reading the NESTLEIND chart. Not a substitute for a registered research note.
| Ticker | NESTLEIND |
|---|---|
| Full name | NESTLE INDIA LIMITED |
| Sector | Fast Moving Consumer Goods |
| Index class | LARGE CAP |
| ISIN | INE239A01024 |
| Market-cap band | ~2.8 lakh cr (indicative) |
| Last referenced level | Inside latest show |
| Last session move | Not referenced this cycle |
| Editorial line in | Systematic Read on 21 Jul 2026 |
| Aliases tracked | NESTLEIND |
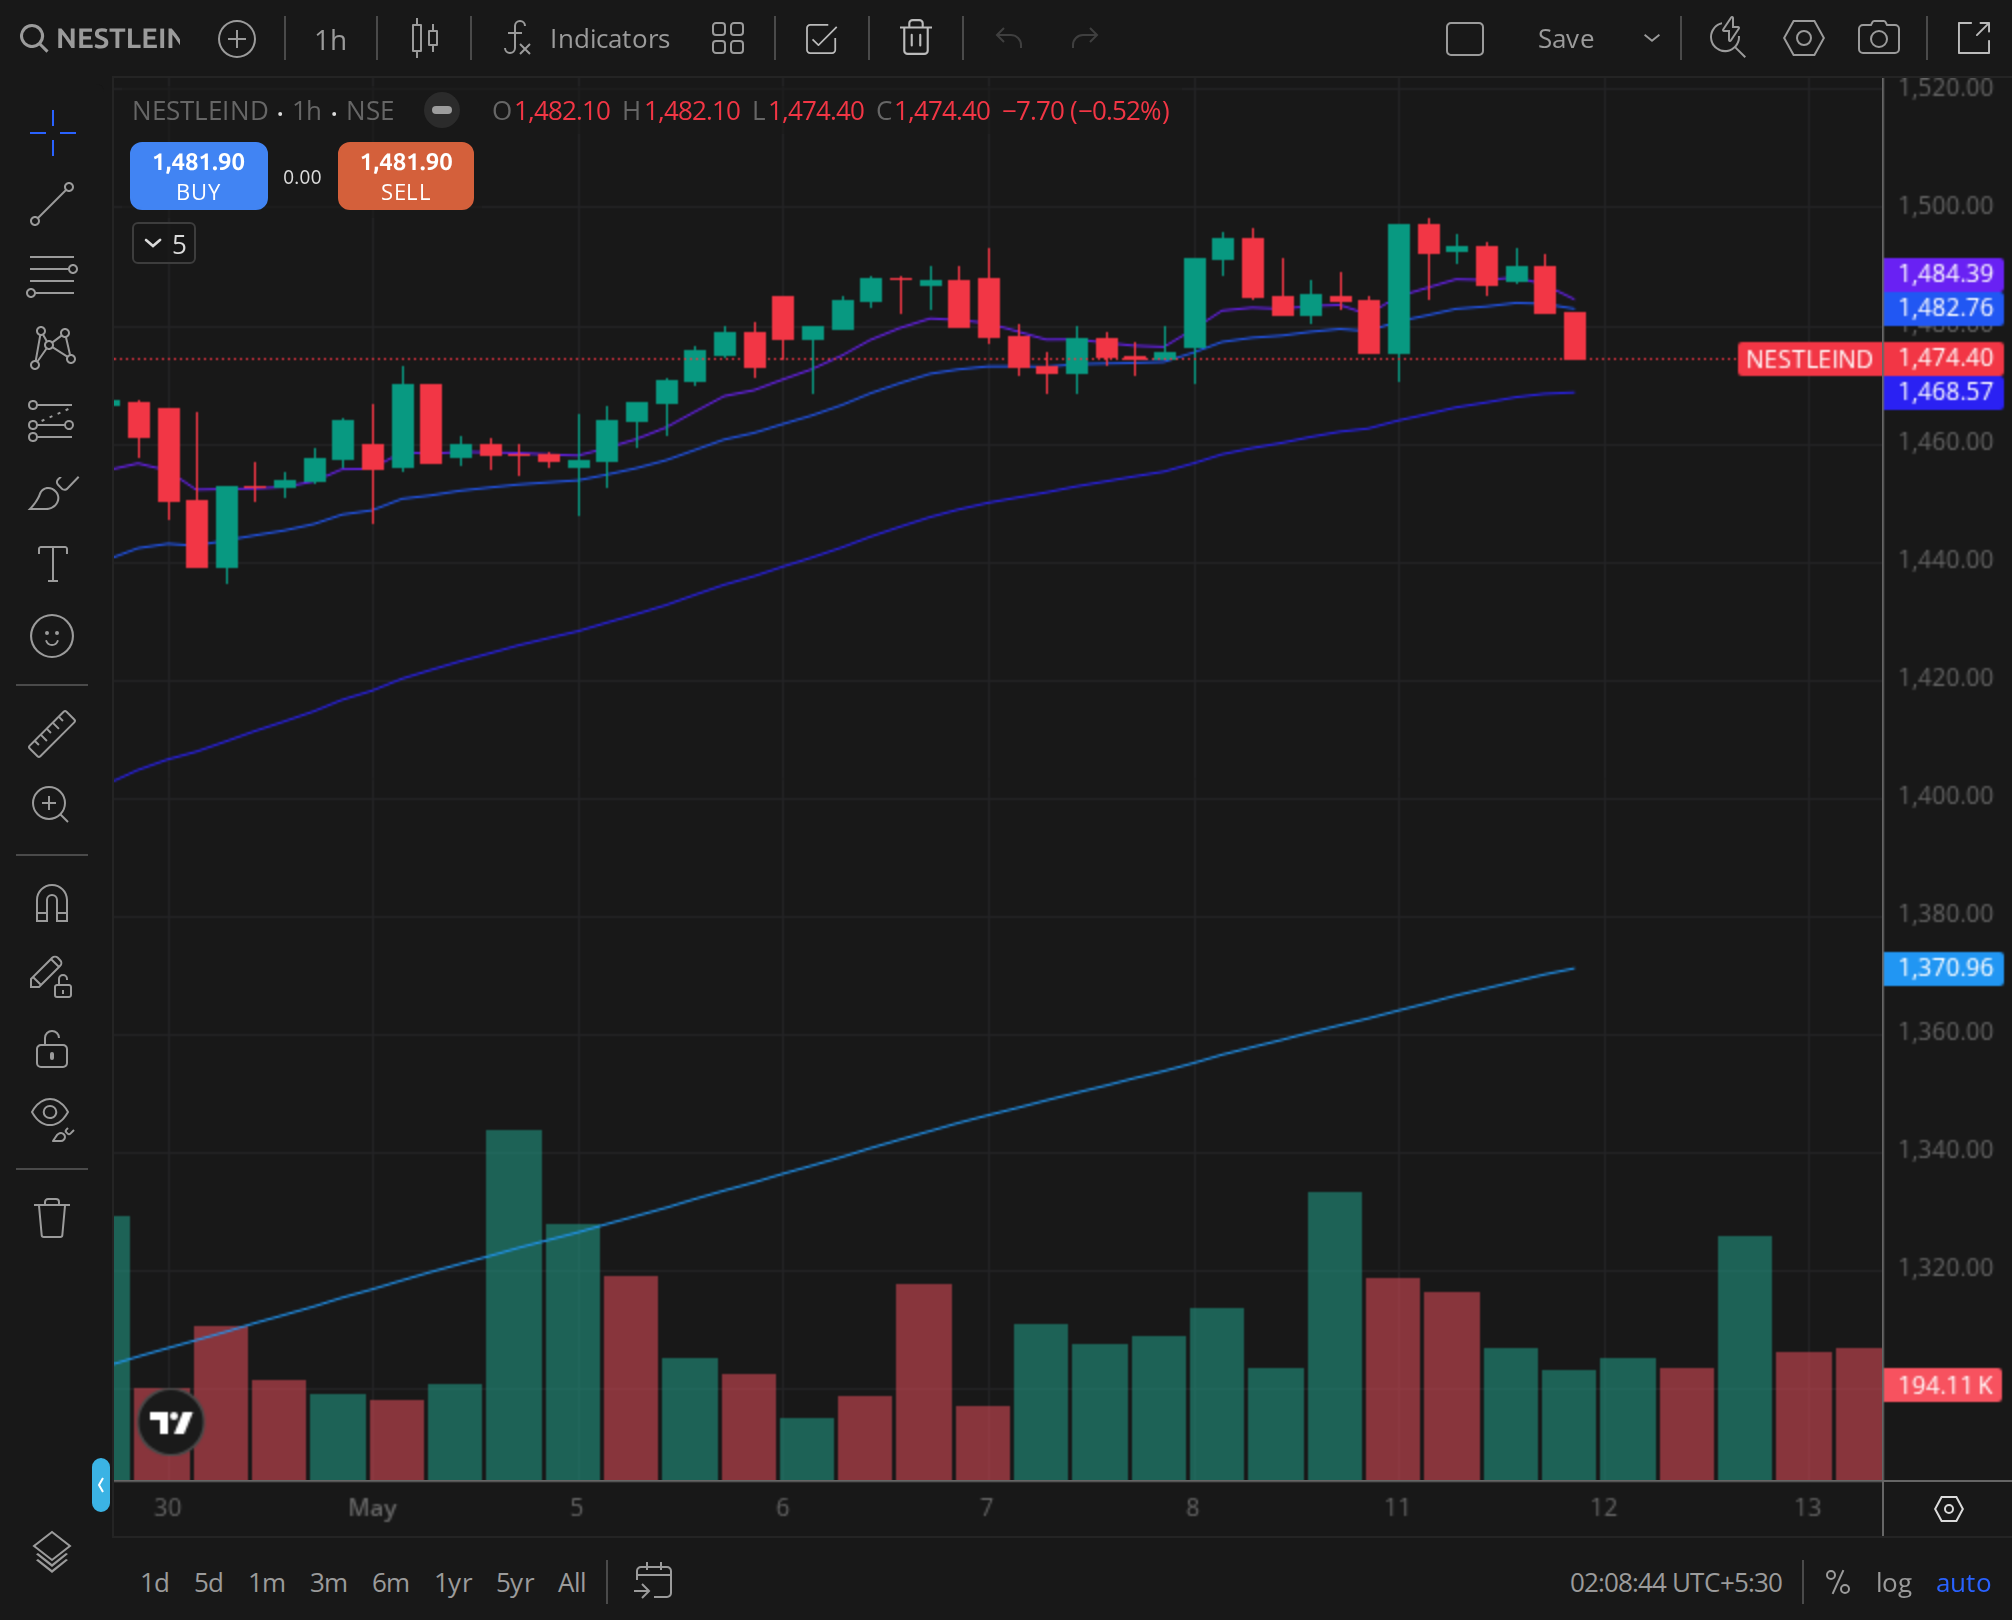
Reference chart18 Dec 2024
The daily frame the desk reads on NESTLEIND.
FAQ16 reader questions · AEO-eligible
The line on NESTLEIND, distilled and schema-marked for AI Overview, Perplexity, and reader search.
What is the NESTLEIND share price target for 2026?
BazaarBaazi does not publish a SEBI-registered price target on NESTLEIND. The desk reads structural support and resistance inside each show against the printed spot; the most recent editorial line is Systematic Read on 21 Jul 2026.
What is BazaarBaazi's Crack Score for NESTLEIND?
The BazaarBaazi Crack Score for NESTLEIND is 82 out of 100 as of 21 Jul 2026, a high conviction reading. It is a computed conviction number from the signed stance, how consistent the recent verdicts have been, the quality of the printed structure, and how fresh the review is. It is a transparency signal, not investment advice.
What is the F&O view on NESTLEIND?
Strike-level option inventory for NESTLEIND is unavailable, so BazaarBaazi withholds participant, direction and positioning claims. The editorial chart stance is not substituted for an option-chain observation.
What sector is NESTLEIND in and which peers does BazaarBaazi track?
NESTLEIND sits in Fast Moving Consumer Goods (large cap), indicative market cap ~2.8 lakh cr (indicative), ISIN INE239A01024. The peers BazaarBaazi reads alongside it are CCL PRODUCTS (INDIA) LIMITED, ZYDUS WELLNESS LIMITED, EMAMI LIMITED. A systematic, data-only read on NESTLE INDIA LIMITED: where it trades versus its 50-day and 200-day lines, the live 52-week range, and momentum, refreshed from the scanner's real price series each run.
How often is the NESTLEIND view updated?
This page is one evergreen URL refreshed in place. The Crack Score and levels re-compute on every BazaarBaazi end-of-day run, and the dated stamp shows the last refresh. The latest signed verdict on NESTLEIND is bullish, published in Systematic Read on 21 Jul 2026.
Is Nestle India a good long-term stock?
The case is a high-quality branded food company with pricing power and parent backing held at a premium valuation, but the risk no score captures is heavy reliance on Maggi plus a perceived-value ceiling that makes passing on cocoa and wheat inflation hard. BazaarBaazi's Crack Score for NESTLEIND captures the current setup. The long-term view rests on whether volume growth and premiumisation can compound alongside India's rising per-capita food spend.
Nestle India share price target 2030?
What would drive NESTLEIND through 2030 is Maggi's sustained dominance, new category penetration and margin expansion through premiumisation, with the catch that on a high-PE name any volume stumble or de-rating can hurt more than a target implies. BazaarBaazi does not publish fixed multi-year targets. The dated Crack Score is the right entry point.
Why is Nestle India share falling?
Pressure on NESTLEIND usually comes from the inputs the desk watches first, commodity cost spikes in wheat or cocoa and any Maggi volume miss, with high-PE de-rating or a rural slowdown adding to it. The Crack Score levels show the technical setup.
Is NESTLEIND a qualifying setup on the BazaarBaazi scanner right now?
On the 2026-07-31 run of the 500-name BazaarBaazi setup scanner, NESTLE INDIA LIMITED sits in the Scanned tier with a setup score of 89/100 (technical 100, fundamental 100). The scanner is a deterministic engine over real OHLCV and official filings, refreshed nightly, and it is a signal rather than investment advice.
Where can I read NESTLE INDIA LIMITED's earnings call transcripts?
BazaarBaazi indexes 4 NESTLEIND earnings calls going back to 2022-08-31, latest 2025-02-28. Every entry on this page links straight to the transcript PDF the company filed with the exchange, so you read management in the primary source.
What was NESTLE INDIA LIMITED's Q4 FY26 net profit?
NESTLE INDIA LIMITED reported a net profit of Rs 1,111 cr for Q4 FY26 (the quarter ended 31 March 2026). That is +27.2% year on year. The figure is from the company's official NSE filing.
What was NESTLE INDIA LIMITED's Q4 FY26 revenue?
NESTLE INDIA LIMITED reported revenue of Rs 6,748 cr for Q4 FY26. That is +22.6% year on year. The figure is from the company's official NSE filing.
How does BazaarBaazi rate NESTLE INDIA LIMITED's Q4 FY26 result?
BazaarBaazi gives NESTLE INDIA LIMITED's Q4 FY26 result a Result Pulse of 100 out of 100, with a verdict of Profit acceleration. The Result Pulse is a BazaarBaazi editorial score for the quality of the filed result, not investment advice.
What has Nestle India Ltd announced recently?
Nestle India Ltd's two most material recent disclosures are an agm / egm dated 30 Jul 2026, and a press release dated 24 Jul 2026, "Newspaper advertisement Public Notice regarding loss of…". Both link to the company's own official filing on the BazaarBaazi stock page.
Has Nestle India Ltd declared a dividend recently?
Yes. Nestle India Ltd filed a dividend disclosure on 10 Jul 2026, filed as "Special Dividend - Rs 2 Per Share". Any amount shown is the exchange's own record, linked from the BazaarBaazi stock page. A dividend is a declared payout, not a forecast of future returns.
What did Nestle India Ltd's latest board meeting cover?
Nestle India Ltd's most recent board-meeting disclosure on record dated 22 Jul 2026 reads "Board Meeting to be held on 22-Jul-2026 to inter-alia consider and…". That is the agenda as filed with the exchange, linked from the BazaarBaazi stock page, and BazaarBaazi adds no claim of its own to it.
Related stock views
The names BazaarBaazi reads alongside NESTLEIND, each a living view refreshed every end-of-day run.
Hub
All stock views
The full BazaarBaazi coverage universe, scored and dated.
Fast Moving Consumer Goods
CCL
CCL PRODUCTS (INDIA) LIMITED
Fast Moving Consumer Goods
ZYDUSWELL
ZYDUS WELLNESS LIMITED
Fast Moving Consumer Goods
EMAMILTD
EMAMI LIMITED
Fast Moving Consumer Goods
ABDL
Allied Blenders and Distillers Limited
Fast Moving Consumer Goods
AWL
AWL AGRI BUSINESS LIMITED