Stock · MM · Automobile and Auto Components
MM share price target 2026
Support, resistance, the F&O structure and the BazaarBaazi Crack Score for Mahindra and Mahindra Limited, refreshed every end-of-day run. A systematic, data-only read on Mahindra and Mahindra Limited: where it trades versus its 50-day and 200-day lines, the live 52-week range, and momentum, refreshed from the scanner's real price series each run.
The verdict
BazaarBaazi reads MM as two-way with a Crack Score of 65/100 as of 21 Jul 2026.
BazaarBaaziSource & method
The scanner's readScanned · scanned 31 Jul 2026
Where MM stands on the 500-name BazaarBaazi setup scanner: technicals, filed fundamentals and money flow read together, refreshed every run.
Scanned and scored this run, but the evidence is incomplete or conflicted. The engine fails closed to NO_TRADE.
Technical axis
83/100Fundamental axis
100/100Money flow
59/100Result pulse · Q4 FY26
95/100Technical evidence
relative strength rising vs NIFTY
RS slope +5.4% (3m)
outperforming and above 50DMA
Fundamental evidence
net profit +48.51% YoY
revenue +29.07% YoY
net margin 9.57%
result score 95.0/100
cheaper than sector (0.54x median)
Red flags
above 200DMA (not a confirmed short-side trend)
profit growth strong (+48.51% YoY)
strong filed result (score 95.0)
Relative valuation
P/E (TTM)
22.2P/E vs sector
+0.5%Sector percentile
23PEG
0.46Scanner levels from the deterministic engine run of 2026-07-31, not a SEBI-registered recommendation and not investment advice. The fundamental axis reads the official filing: Q4 FY26 result.
Price target: support and resistanceComputed 21 Jul 2026
Support and resistance for MM are read inside the latest show; no spot was printed in the most recent editorial note.
Levels are read inside the latest show. The most recent editorial reference is Systematic Read on 21 Jul 2026.
These are structural reference lines, not a SEBI-registered price target. BazaarBaazi is independent media; the levels frame how the desk reads the MM chart, refreshed every end-of-day run.
The Crack Score, and how it is built65 / 100 · Constructive
The Crack Score is a deterministic 0 to 100 conviction number. Here is exactly what moved it for MM, so the figure is a transparent signal rather than a vibe.
Base 50, adjusted by the factors above and clamped to 0 to 100. How the Crack Score works.
About Mahindra and Mahindra LimitedBusiness profile
What MM actually does, and the edge that holds its position.
Mahindra is the rare name that wins on the two ends of India at once, the aspirational SUV buyer and the farmer, and that pairing is what makes the stock unusual. It dominates the mid-to-large UV segment through Scorpio, XUV700 and Thar, and is India's largest tractor brand by volume through Mahindra Tractors. The group also carries a sprawling set of subsidiaries across financial services, IT, real estate and auto components, most separately listed, so the listed parent is really a UV-plus-tractor bet with a holding-company tail.
Mahindra's moat in the UV space is brand ruggedness and off-road credibility built over decades, translated into pricing power in the lifestyle SUV segment. In tractors, its rural distribution and farm-financing ecosystem through Mahindra Finance gives it sticky reach in markets where trust and credit access matter as much as the product.
The F&O viewHorizon · swing
How the futures and options structure on MM reads right now.
The editorial price read on MM is mixed. Strike-level option inventory is unavailable, so the page withholds writer, wall and pin claims. Single-stock F&O on MM can be thinner than index F&O, so the desk weights price and filed evidence over raw OI. This is not a derivatives trade recommendation.
Why it movedLatest editorial line
The most recent BazaarBaazi read on what is driving MM.
Systematic read: a disclosed, data-only model on real 1-year price structure.
Read in Systematic Read on 21 Jul 2026. Why MM moved, the living explainer, tracks every move on one URL.
The 2026 to 2030 pictureStructural read
What genuinely drives MM over a multi-year horizon. A structural read, not a price forecast.
From 2026 to 2030, the key driver is sustained UV segment momentum as India's preference for SUVs deepens, alongside M&M's own electric SUV lineup scaling under the BE and XEV platforms. The tractor segment is exposed to rural income cycles and monsoon variability, which creates earnings lumpiness. The key risk is that the EV transition in the UV segment invites better-capitalised global rivals into M&M's home turf. What BazaarBaazi thinks: M&M has earned its SUV momentum and the tractor franchise is a genuine moat, but the lumpiness no score smooths out is the monsoon, one bad rural year and the tractor leg of the story stalls regardless of how strong the SUV order book looks.
What to watch:
- UV booking momentum and waiting periods for XUV700, Scorpio-N and new EV models
- Tractor industry volume as a barometer of rural income and kharif/rabi cycles
- EV platform rollout timeline and competitive pricing versus TATAMOTORS and Maruti
- Group-level capital allocation and subsidiary monetisation decisions
- Farm loan waiver policies and their impact on rural discretionary spending
Peers and how to compare4 listed names
The listed names MM is most often read against. Compare them on the same Crack Score and levels.
Maruti Suzuki India · MARUTI
Read the MARUTI verdict and levels
Tata Motors · TATAMOTORS
Read the TATAMOTORS verdict and levels
Hyundai Motor India
Listed peer in the same space
Eicher Motors · EICHERMOT
Read the EICHERMOT verdict and levels
Stored valuation readStored 2026-10-19
P/E, P/B, yield and the quality set for Mahindra and Mahindra Limited, computed only from the stored fundamentals snapshot dated 2026-10-19. No carried market price is presented as current.
P / E
17.7x
Earnings yield
5.65%
P / B
3.49x
P / S
1.63x
EV / EBITDA
10.9x
Dividend yield
1.14%
Market cap
Rs 3.49 lakh cr
Enterprise value
Rs 4.35 lakh cr
Stored from Mahindra and Mahindra Limited's filed results, as of 2026-10-19 and currency-checked. Price input Rs 2,907.00 from baked EOD spot. Open the calculator, move the price and watch every ratio react.
Latest filed resultsQ4 FY26
Mahindra and Mahindra Limited's most recent quarter, parsed straight from the official NSE filing. Every figure links back to its primary source.
Result Pulse
95 / 100Revenue
Rs 54,982 crNet profit
Rs 5,260 crEPS (quarter)
Rs 41.77| Growth | YoY | QoQ |
|---|---|---|
| Revenue | +29.1% | +5.5% |
| Net profit | +48.5% | +4.8% |
| Net margin | +9.6% | |
Figures are the Q4 FY26 result for Mahindra and Mahindra Limited, parsed straight from the official NSE integrated filing and verified to the paisa. The EPS shown is for the quarter, not a trailing-twelve-month figure, so it is not a P/E input.
Earnings history, every filed quarter32 quarters on record
Mahindra and Mahindra Limited's official quarterly revenue, EPS and Result Pulse trail, every quarter the desk holds from the verified filings export, back to 30 Jun 2018. These are quarterly facts, not TTM valuation inputs.
M&M official result trail
32 quarters
Quarterly figures only: revenue, net profit and EPS are copied from official filings. EPS here is not trailing twelve month EPS and is not used for valuation.
| Quarter | Revenue | EPS | PAT YoY | Pulse | Source |
|---|---|---|---|---|---|
| Q4 FY26ended 31 Mar 2026 / Consolidated, audited | Rs 54,982 cr | Rs 41.77 | n/a | n/a | Filing |
| Q3 FY26ended 31 Dec 2025 / Consolidated, audited | Rs 52,100 cr | Rs 41.85 | n/a | 60/100 | Filing |
| Q2 FY26ended 30 Sep 2025 / Consolidated, audited | Rs 46,106 cr | Rs 32.90 | n/a | 50/100 | Filing |
| Q1 FY26ended 30 Jun 2025 / Consolidated, audited | Rs 45,529 cr | Rs 36.58 | n/a | 50/100 | Filing |
| Q4 FY25ended 31 Mar 2025 / Consolidated, audited | Rs 42,599 cr | Rs 29.52 | n/a | 50/100 | Filing |
| Q3 FY25ended 31 Dec 2024 / Consolidated, audited | Rs 41,470 cr | Rs 28.51 | n/a | n/a | Filing |
| Q2 FY25ended 30 Sep 2024 / Consolidated, audited | Rs 37,924 cr | Rs 28.43 | n/a | n/a | Filing |
| Q1 FY25ended 30 Jun 2024 / Consolidated, audited | Rs 37,218 cr | Rs 29.44 | n/a | n/a | Filing |
| Q4 FY24ended 31 Mar 2024 / Consolidated, audited | Rs 35,452 cr | Rs 24.71 | n/a | n/a | Filing |
| Q3 FY24ended 31 Dec 2023 / Consolidated, audited | Rs 35,299 cr | Rs 23.86 | n/a | n/a | Filing |
| Q2 FY24ended 30 Sep 2023 / Consolidated, audited | Rs 34,436 cr | Rs 21.07 | n/a | n/a | Filing |
| Q1 FY24ended 30 Jun 2023 / Consolidated, audited | Rs 33,892 cr | Rs 31.50 | n/a | n/a | Filing |
| Q4 FY23ended 31 Mar 2023 / Consolidated, audited | Rs 32,366 cr | Rs 23.68 | n/a | n/a | Filing |
| Q3 FY23ended 31 Dec 2022 / Consolidated, audited | Rs 30,620 cr | Rs 24.05 | n/a | n/a | Filing |
| Q2 FY23ended 30 Sep 2022 / Consolidated, audited | Rs 29,870 cr | Rs 24.93 | n/a | n/a | Filing |
| Q1 FY23ended 30 Jun 2022 / Consolidated, audited | Rs 28,412 cr | Rs 19.74 | n/a | n/a | Filing |
| Q4 FY22ended 31 Mar 2022 / Consolidated, audited | Rs 25,934 cr | Rs 20.13 | n/a | n/a | Filing |
| Q3 FY22ended 31 Dec 2021 / Consolidated, audited | Rs 23,594 cr | Rs 17.89 | n/a | n/a | Filing |
| Q2 FY22ended 30 Sep 2021 / Consolidated, audited | Rs 21,470 cr | Rs 17.35 | n/a | n/a | Filing |
| Q1 FY22ended 30 Jun 2021 / Consolidated, audited | Rs 19,172 cr | Rs 3.82 | n/a | n/a | Filing |
| Q4 FY21ended 31 Mar 2021 / Consolidated, audited | Rs 21,456 cr | Rs 9.64 | n/a | n/a | Filing |
| Q3 FY21ended 31 Dec 2020 / Consolidated, audited | Rs 21,626 cr | Rs 6.35 | n/a | n/a | Filing |
| Q2 FY21ended 30 Sep 2020 / Consolidated, audited | Rs 23,567 cr | Rs 1.22 | n/a | n/a | Filing |
| Q1 FY21ended 30 Jun 2020 / Consolidated, audited | Rs 16,321 cr | Rs -0.88 | n/a | n/a | Filing |
| Q4 FY20ended 31 Mar 2020 / Consolidated, audited | Rs 20,182 cr | Rs -12.04 | n/a | n/a | Filing |
| Q3 FY20ended 31 Dec 2019 / Consolidated, audited | Rs 25,020 cr | Rs 1.80 | n/a | n/a | Filing |
| Q2 FY20ended 30 Sep 2019 / Consolidated, audited | Rs 23,936 cr | Rs 3.14 | n/a | n/a | Filing |
| Q1 FY20ended 30 Jun 2019 / Consolidated, audited | Rs 26,041 cr | Rs 8.25 | n/a | n/a | Filing |
| Q4 FY19ended 31 Mar 2019 / Standalone, audited | Rs 14,035 cr | Rs 7.13 | n/a | n/a | Filing |
| Q3 FY19ended 31 Dec 2018 / Standalone, audited | Rs 13,070 cr | Rs 9.04 | n/a | n/a | Filing |
| Q2 FY19ended 30 Sep 2018 / Standalone, audited | Rs 12,989 cr | Rs 13.86 | n/a | n/a | Filing |
| Q1 FY19ended 30 Jun 2018 / Standalone, audited | Rs 13,520 cr | Rs 10.26 | n/a | n/a | Filing |
The official financialsFiled to 31 Mar 2026
Mahindra and Mahindra Limited's statements as filed: trailing twelve month P&L, the balance sheet, and the cash engine. Parsed from official XBRL, shown in crore.
Trailing twelve months, on filed quarters
Revenue (TTM)
1,98,639 crNet profit (TTM)
18,622 crEBIT (TTM)
32,811 crProfit before tax (TTM)
23,220 crNet margin (TTM)
9.4%Finance costs (TTM)
9,591 crBalance sheet, as filed 2026-03-31
Total assets
3,17,635 crShareholder equity
1,09,491 crTotal borrowings
1,29,615 crCash and equivalents
4,292 crInventory
22,044 crTrade receivables
9,064 crThe cash engine, latest filed year
Operating cash flow
11,657 crCapex
9,605 crFree cash flow
2,052 crInvesting flow
-17,794 crFinancing flow
5,391 crAnnual trail, filed year over filed year
| Year | Revenue | Net profit | Equity | Borrowings | CFO |
|---|---|---|---|---|---|
| FY26 | 1,98,639 cr | 18,622 cr | 1,09,491 cr | 1,29,615 cr | 11,657 cr |
| FY25 | 1,59,211 cr | 14,073 cr | 89,098 cr | 1,21,173 cr | 3,176 cr |
| FY24 | 1,39,078 cr | 12,270 cr | 77,509 cr | 1,03,203 cr | -5,630 cr |
| FY23 | 1,21,269 cr | 11,374 cr | 67,082 cr | 92,247 cr | -7,074 cr |
| FY22 | 90,171 cr | 7,253 cr | 56,825 cr | 77,605 cr | 9,248 cr |
| FY21 | 74,278 cr | 1,512 cr | 50,652 cr | 59,553 cr | n/a |
Every figure is parsed from Mahindra and Mahindra Limited's official NSE XBRL filings by the BazaarBaazi earnings lab and shown in crore rupees. Display data, not a valuation model input.
Management on record14 earnings calls
Every MM earnings call BazaarBaazi has indexed, latest 31 May 2026. Read management in its own words, straight from the filed transcript.
Mahindra and Mahindra Limited earnings calls on record
14 calls since 28 Feb 2023
Show 6 older calls
Each entry links to the transcript PDF the company filed with the exchange. Primary sources, in management's own words.
What changed120 disclosures
Every recent official filing from Mahindra and Mahindra Limited, straight from the exchange feed, with the BazaarBaazi Event Heat on the disclosure flow.
Mahindra and Mahindra Limited has filed 120 official disclosures recently. The most recent is a AGM / EGM dated 31 Jul 2026.
Disclosure of Voting Results of the Remote E-Voting and Voting at the 80th Annual GeneralMeeting ( AGM ) of the Company held on 30th July 2026
a press release dated 30th July 2026, titled "Press Release on Unaudited Standalone and Consolidated Financial Results of the Company for the First Quarter ended 30th June 2026
Mahindra & Mahindra Limited has submitted to the Exchange, the financial results for the period ended 30 June 2026.
Link of Audio-Video recording of M&M Analyst Meet Q1FY27 Earnings Conference Call
Proposed fund raising by Mahindra Last Mile Mobility Limited, a subsidiary of the Company, at a valuation of Rs.10,822 crore
Event Heat is withheld because the reproducible what-changed window is unavailable. Every line above links to its official exchange filing, and the full market desk is at the disclosures hub.
Key fundamentalsEditorial reference
The anchor data BazaarBaazi references when reading the MM chart. Not a substitute for a registered research note.
| Ticker | MM |
|---|---|
| Full name | Mahindra and Mahindra Limited |
| Sector | Automobile and Auto Components |
| Index class | LARGE CAP |
| ISIN | INE101A01026 |
| Market-cap band | ~4.0 lakh cr (indicative) |
| Last referenced level | Inside latest show |
| Last session move | Not referenced this cycle |
| Editorial line in | Systematic Read on 21 Jul 2026 |
| Aliases tracked | MM, M&M |
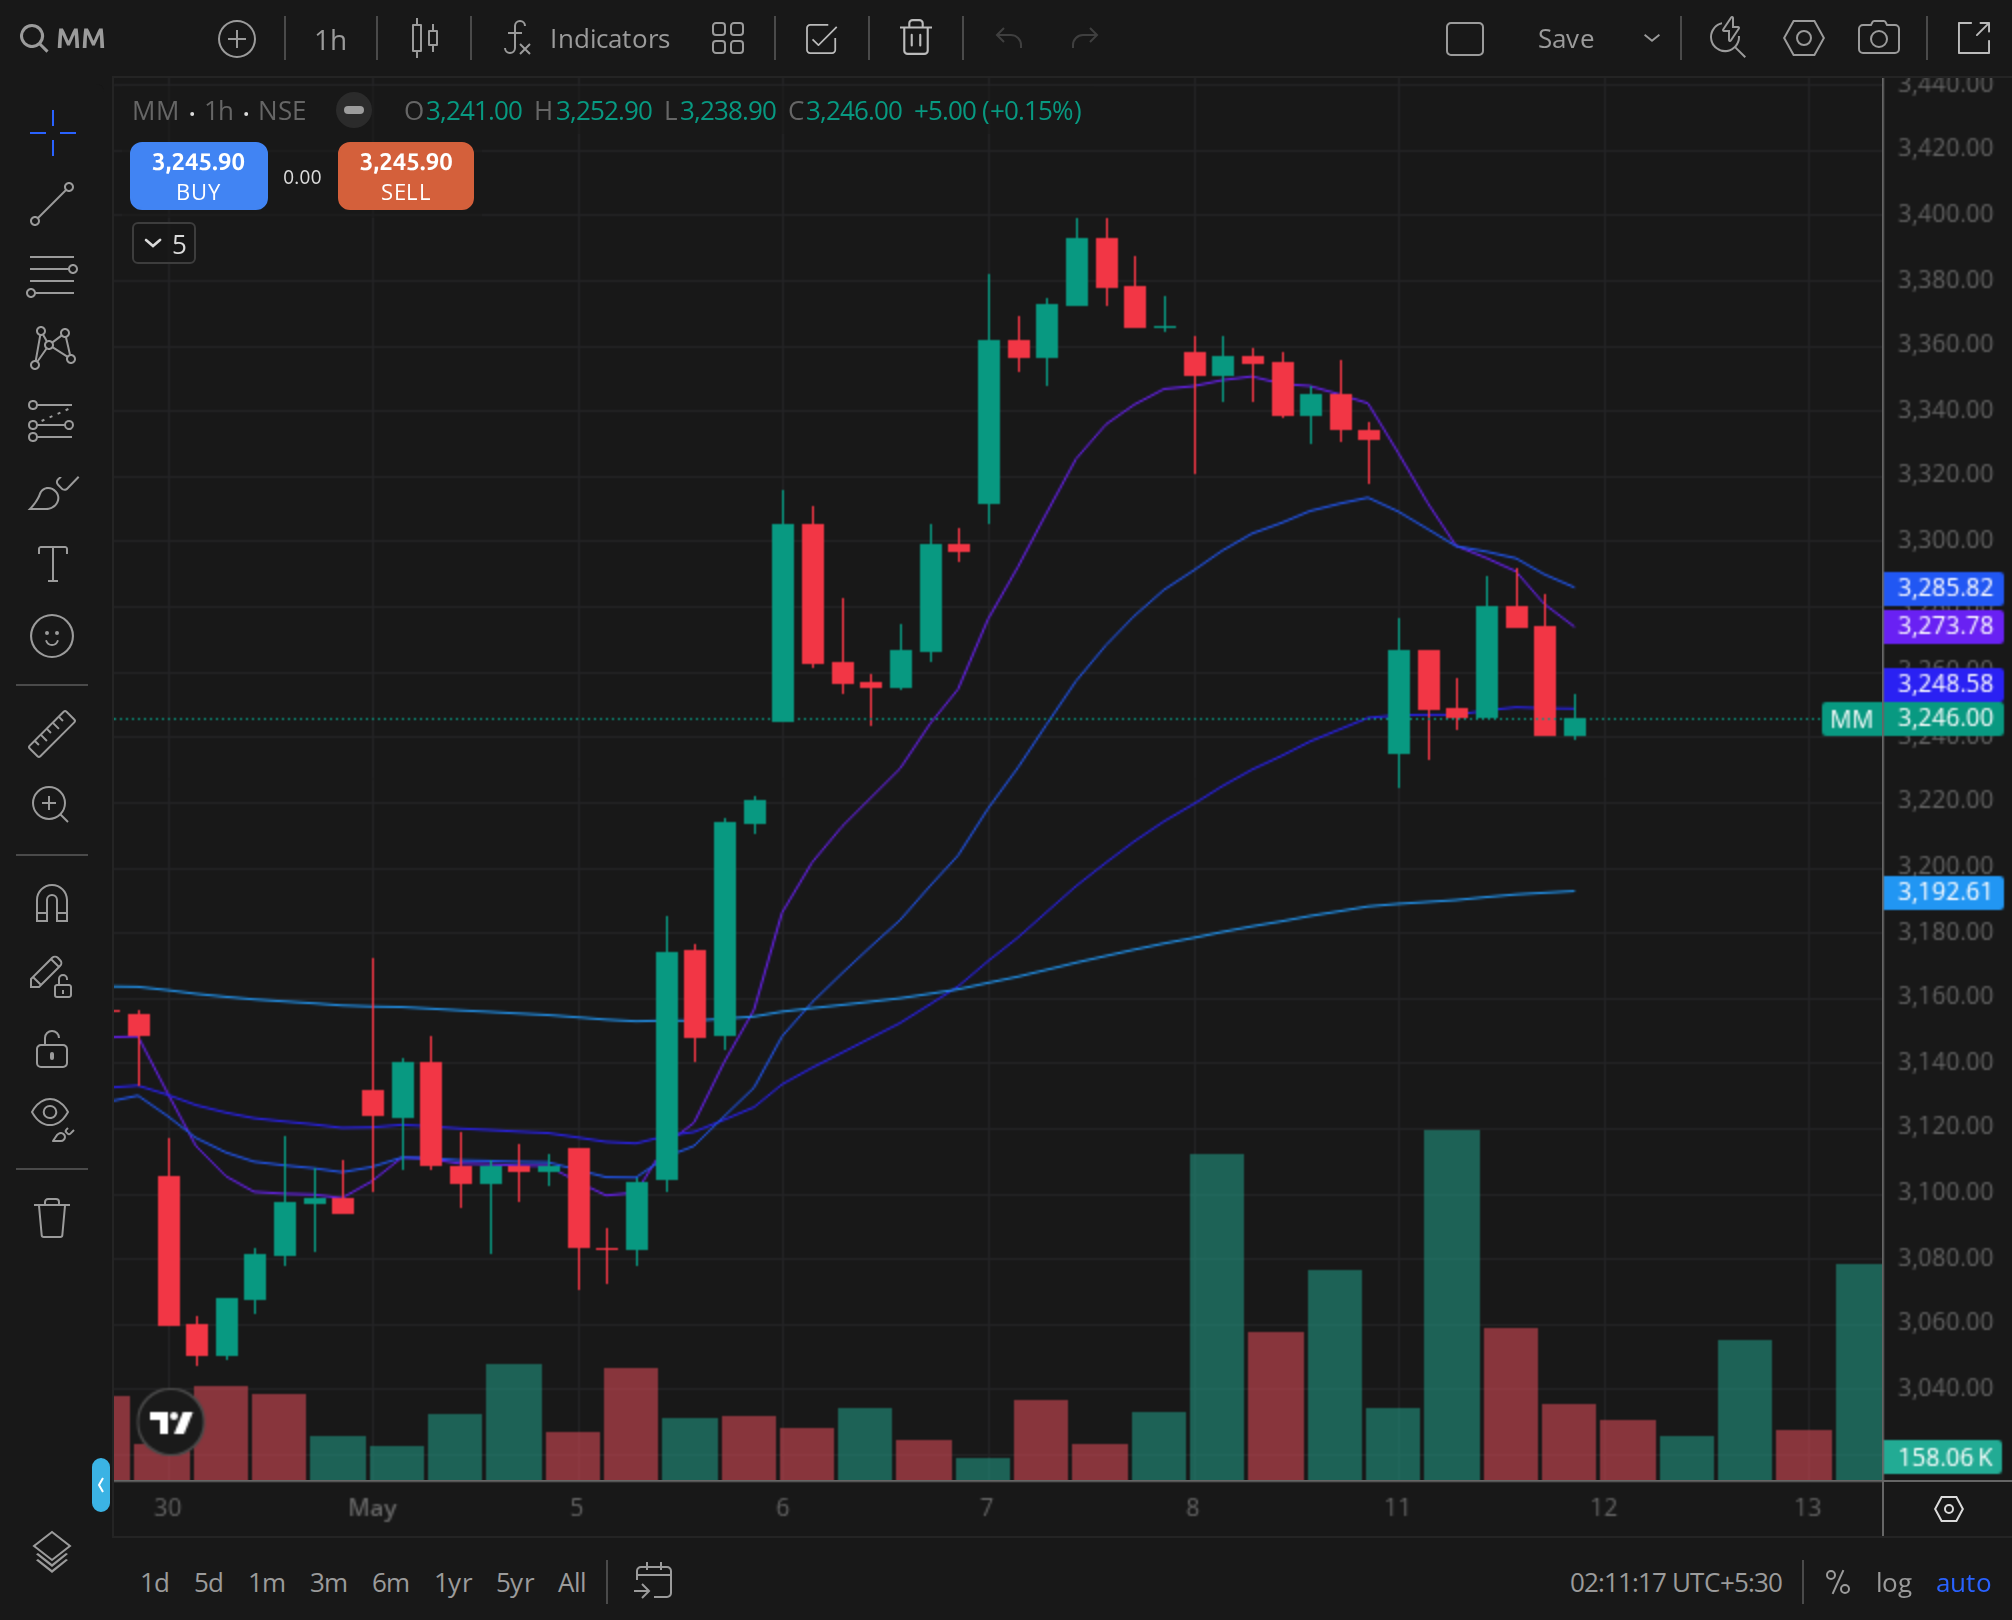
Reference chart15 Dec 2025
The daily frame the desk reads on MM.
FAQ16 reader questions · AEO-eligible
The line on MM, distilled and schema-marked for AI Overview, Perplexity, and reader search.
What is the MM share price target for 2026?
BazaarBaazi does not publish a SEBI-registered price target on MM. The desk reads structural support and resistance inside each show against the printed spot; the most recent editorial line is Systematic Read on 21 Jul 2026.
What is BazaarBaazi's Crack Score for MM?
The BazaarBaazi Crack Score for MM is 65 out of 100 as of 21 Jul 2026, a constructive reading. It is a computed conviction number from the signed stance, how consistent the recent verdicts have been, the quality of the printed structure, and how fresh the review is. It is a transparency signal, not investment advice.
What is the F&O view on MM?
Strike-level option inventory for MM is unavailable, so BazaarBaazi withholds participant, direction and positioning claims. The editorial chart stance is not substituted for an option-chain observation.
What sector is MM in and which peers does BazaarBaazi track?
MM sits in Automobile and Auto Components (large cap), indicative market cap ~4.0 lakh cr (indicative), ISIN INE101A01026. The peers BazaarBaazi reads alongside it are ATHER ENERGY LIMITED, SONA BLW PRECISION FORGINGS LIMITED, Endurance Technologies Limited. A systematic, data-only read on Mahindra and Mahindra Limited: where it trades versus its 50-day and 200-day lines, the live 52-week range, and momentum, refreshed from the scanner's real price series each run.
How often is the MM view updated?
This page is one evergreen URL refreshed in place. The Crack Score and levels re-compute on every BazaarBaazi end-of-day run, and the dated stamp shows the last refresh. The latest signed verdict on MM is mixed, published in Systematic Read on 21 Jul 2026.
Is Mahindra and Mahindra a good long-term stock?
The structural case rests on India's durable shift toward SUVs and the rural income story that drives tractors, but the risk no score captures is monsoon-driven rural cyclicality that can swing the tractor half of earnings independent of how the UVs are selling. BazaarBaazi publishes a dated Crack Score for MM that captures the current technical and thematic setup. The long-term view depends on how the EV transition and rural cycles play out.
Mahindra share price target 2030?
What would lift MM through 2030 is UV volume leadership and EV platform success riding a multi-year rural income recovery, with the unmodellable catch that the same EV shift could invite better-funded global rivals straight into M&M's home turf. BazaarBaazi does not publish fixed multi-year price targets. Check the live Crack Score for the dated structural read.
Why is Mahindra share falling?
Weakness in MM usually traces to the three triggers the desk tracks, a UV volume disappointment, a poor monsoon flagging tractor-demand headwinds, or EV launch delays against competitor timelines. The Crack Score levels give the current technical context.
Is MM a qualifying setup on the BazaarBaazi scanner right now?
On the 2026-07-31 run of the 500-name BazaarBaazi setup scanner, Mahindra and Mahindra Limited sits in the Scanned tier with a setup score of 87/100 (technical 83, fundamental 100). The scanner is a deterministic engine over real OHLCV and official filings, refreshed nightly, and it is a signal rather than investment advice.
Where can I read Mahindra and Mahindra Limited's earnings call transcripts?
BazaarBaazi indexes 14 MM earnings calls going back to 2023-02-28, latest 2026-05-31. Every entry on this page links straight to the transcript PDF the company filed with the exchange, so you read management in the primary source.
What was Mahindra and Mahindra Limited's Q4 FY26 net profit?
Mahindra and Mahindra Limited reported a net profit of Rs 5,260 cr for Q4 FY26 (the quarter ended 31 March 2026). That is +48.5% year on year. The figure is from the company's official NSE filing.
What was Mahindra and Mahindra Limited's Q4 FY26 revenue?
Mahindra and Mahindra Limited reported revenue of Rs 54,982 cr for Q4 FY26. That is +29.1% year on year. The figure is from the company's official NSE filing.
How does BazaarBaazi rate Mahindra and Mahindra Limited's Q4 FY26 result?
BazaarBaazi gives Mahindra and Mahindra Limited's Q4 FY26 result a Result Pulse of 95 out of 100, with a verdict of Profit acceleration. The Result Pulse is a BazaarBaazi editorial score for the quality of the filed result, not investment advice.
What has Mahindra and Mahindra Ltd announced recently?
Mahindra and Mahindra Ltd's two most material recent disclosures are an agm / egm dated 31 Jul 2026, "Voting Results of the Remote E-Voting and Voting at the…", and a disclosure dated 31 Jul 2026, "Copy of Newspaper Publication". Both link to the company's own official filing on the BazaarBaazi stock page.
Has Mahindra and Mahindra Ltd declared a dividend recently?
Yes. Mahindra and Mahindra Ltd filed a dividend disclosure on 03 Jul 2026, filed as "Dividend - Rs 33 Per Share". Any amount shown is the exchange's own record, linked from the BazaarBaazi stock page. A dividend is a declared payout, not a forecast of future returns.
What did Mahindra and Mahindra Ltd's latest board meeting cover?
Mahindra and Mahindra Ltd's most recent board-meeting disclosure on record dated 30 Jul 2026 reads "Outcome of Board Meeting held on July 30, 2026". That is the agenda as filed with the exchange, linked from the BazaarBaazi stock page, and BazaarBaazi adds no claim of its own to it.
Related stock views
The names BazaarBaazi reads alongside MM, each a living view refreshed every end-of-day run.
Hub
All stock views
The full BazaarBaazi coverage universe, scored and dated.
Automobile and Auto Components
ATHERENERG
ATHER ENERGY LIMITED
Automobile and Auto Components
SONACOMS
SONA BLW PRECISION FORGINGS LIMITED
Automobile and Auto Components
ENDURANCE
Endurance Technologies Limited
Automobile and Auto Components
APOLLOTYRE
APOLLO TYRES LIMITED
Automobile and Auto Components
AREM
AMARA RAJA ENERGY & MOBILITY LIMITED