Stock · LT · Construction
LT share price target 2026
Support, resistance, the F&O structure and the BazaarBaazi Crack Score for LARSEN & TOUBRO LIMITED, refreshed every end-of-day run. A systematic, data-only read on LARSEN & TOUBRO LIMITED: where it trades versus its 50-day and 200-day lines, the live 52-week range, and momentum, refreshed from the scanner's real price series each run.
The verdict
BazaarBaazi reads LT as cautious with a Crack Score of 43/100 as of 21 Jul 2026.
BazaarBaaziSource & method
The scanner's readScanned · scanned 31 Jul 2026
Where LT stands on the 500-name BazaarBaazi setup scanner: technicals, filed fundamentals and money flow read together, refreshed every run.
Scanned and scored this run, but the evidence is incomplete or conflicted. The engine fails closed to NO_TRADE.
Technical axis
79/100Fundamental axis
33/100Money flow
31/100Result pulse · Q4 FY26
0/100Technical evidence
money-flow score 30.6/100 (weak)
Chaikin money flow -0.151 (distribution)
net -5 accumulation days (25d)
OBV falling
RS slope -3.3% (3m)
relative strength falling vs NIFTY
below 50DMA
Valuation and context
P/E 33.7 vs sector median 23.5 (1.43x, 69th pctile)
Red flags
above 200DMA (not a confirmed short-side trend)
weak filed result (score 0.0)
Relative valuation
P/E (TTM)
33.7P/E vs sector
+1.4%Sector percentile
69PEG
n/aScanner levels from the deterministic engine run of 2026-07-31, not a SEBI-registered recommendation and not investment advice. The fundamental axis reads the official filing: Q4 FY26 result.
Price target: support and resistanceComputed 21 Jul 2026
Support and resistance for LT are read inside the latest show; no spot was printed in the most recent editorial note.
Levels are read inside the latest show. The most recent editorial reference is Systematic Read on 21 Jul 2026.
These are structural reference lines, not a SEBI-registered price target. BazaarBaazi is independent media; the levels frame how the desk reads the LT chart, refreshed every end-of-day run.
The Crack Score, and how it is built43 / 100 · Range / mixed
The Crack Score is a deterministic 0 to 100 conviction number. Here is exactly what moved it for LT, so the figure is a transparent signal rather than a vibe.
Base 50, adjusted by the factors above and clamped to 0 to 100. How the Crack Score works.
About LARSEN & TOUBRO LIMITEDBusiness profile
What LT actually does, and the edge that holds its position.
Larsen and Toubro is the contractor India calls when a project is too big or too complex for anyone else, and that reputation for executing the hard jobs is the moat the financials sit on. The engine is infrastructure construction (roads, bridges, metros, airports, buildings) and energy projects (refineries, nuclear, renewables), backed by heavy engineering in reactors and defence equipment. Layered on top are IT services through LTIMindtree and LTI plus a financial-services arm, leaving LT the dominant EPC name for large, complex contracts across both government and private sectors.
LT's edge is its ability to execute technically complex, large-value contracts that require engineering depth, balance-sheet strength and project management capability that smaller contractors cannot match. Its order book at any given time represents years of forward revenue visibility, and its brand is the benchmark for Indian engineering quality.
The F&O viewHorizon · swing
How the futures and options structure on LT reads right now.
The editorial price read on LT is bearish. Strike-level option inventory is unavailable, so the page withholds writer, wall and pin claims. Single-stock F&O on LT can be thinner than index F&O, so the desk weights price and filed evidence over raw OI. This is not a derivatives trade recommendation.
Why it movedLatest editorial line
The most recent BazaarBaazi read on what is driving LT.
Systematic read: a disclosed, data-only model on real 1-year price structure.
Read in Systematic Read on 21 Jul 2026. Why LT moved, the living explainer, tracks every move on one URL.
The 2026 to 2030 pictureStructural read
What genuinely drives LT over a multi-year horizon. A structural read, not a price forecast.
Over 2026 to 2030 LT is a direct play on India's infrastructure capex cycle, which includes National Infrastructure Pipeline projects, defence indigenisation orders, and the data-centre and semiconductor capex wave that feeds its technology subsidiaries. The risk is margin pressure in competitive bidding environments and any slowdown in government capital expenditure driven by fiscal constraints. WHAT BAZAARBAAZI THINKS: This is the broadest single bet on India actually building, so the order book and execution record are the real assets; the risk the Crack Score cannot fully capture is margin, because a fat order book won at thin bids can grow the top line for years while the profit on each project quietly erodes, so watch what LT wins work at, not just how much it wins.
What to watch:
- Order inflows by segment versus management guidance
- Order book execution rate and project margin trends
- Defence and nuclear heavy engineering order pipeline
- LTIMindtree revenue growth as the IT subsidiary signal
- Working capital and debtor days as execution health metrics
Peers and how to compare5 listed names
The listed names LT is most often read against. Compare them on the same Crack Score and levels.
Tata Projects (unlisted, government projects)
Listed peer in the same space
Shapoorji Pallonji (private, large construction)
Listed peer in the same space
NCC Limited (listed mid-cap EPC)
Listed peer in the same space
KEC International (listed, power transmission EPC)
Listed peer in the same space
Adani Enterprises (group parent vehicle) · ADANIENT
Read the ADANIENT verdict and levels
Stored valuation readStored 2026-10-19
P/E, P/B, yield and the quality set for LARSEN & TOUBRO LIMITED, computed only from the stored fundamentals snapshot dated 2026-10-19. No carried market price is presented as current.
P / E
30.4x
Earnings yield
3.29%
P / B
4.61x
P / S
1.70x
EV / EBITDA
15.9x
Dividend yield
1.04%
Market cap
Rs 5.04 lakh cr
Enterprise value
Rs 5.53 lakh cr
Stored from LARSEN & TOUBRO LIMITED's filed results, as of 2026-10-19 and currency-checked. Price input Rs 3,661.90 from baked EOD spot. Open the calculator, move the price and watch every ratio react.
Latest filed resultsQ4 FY26
LARSEN & TOUBRO LIMITED's most recent quarter, parsed straight from the official BSE filing. Every figure links back to its primary source.
Result Pulse
0 / 100Revenue
Rs 82,762 crNet profit
Rs 6,133 crEPS (quarter)
Rs 38.71| Growth | YoY | QoQ |
|---|---|---|
| Revenue | n/a | n/a |
| Net profit | n/a | n/a |
| Net margin | n/a | |
Figures are the Q4 FY26 result for LARSEN & TOUBRO LIMITED, parsed straight from the official BSE integrated filing and verified to the paisa. The EPS shown is for the quarter, not a trailing-twelve-month figure, so it is not a P/E input.
Earnings history, every filed quarter32 quarters on record
LARSEN & TOUBRO LIMITED's official quarterly revenue, EPS and Result Pulse trail, every quarter the desk holds from the verified filings export, back to 30 Jun 2018. These are quarterly facts, not TTM valuation inputs.
LT official result trail
32 quarters
Quarterly figures only: revenue, net profit and EPS are copied from official filings. EPS here is not trailing twelve month EPS and is not used for valuation.
| Quarter | Revenue | EPS | PAT YoY | Pulse | Source |
|---|---|---|---|---|---|
| Q4 FY26ended 31 Mar 2026 / Consolidated, audited | Rs 82,762 cr | Rs 38.71 | n/a | n/a | Filing |
| Q3 FY26ended 31 Dec 2025 / Consolidated, audited | Rs 71,450 cr | Rs 23.37 | n/a | 44/100 | Filing |
| Q2 FY26ended 30 Sep 2025 / Consolidated, audited | Rs 67,984 cr | Rs 28.54 | n/a | 50/100 | Filing |
| Q1 FY26ended 30 Jun 2025 / Consolidated, audited | Rs 63,679 cr | Rs 26.30 | n/a | 50/100 | Filing |
| Q4 FY25ended 31 Mar 2025 / Consolidated, audited | Rs 74,392 cr | Rs 39.98 | n/a | n/a | Filing |
| Q3 FY25ended 31 Dec 2024 / Consolidated, audited | Rs 64,668 cr | Rs 24.43 | n/a | n/a | Filing |
| Q2 FY25ended 30 Sep 2024 / Consolidated, audited | Rs 61,555 cr | Rs 24.69 | n/a | n/a | Filing |
| Q1 FY25ended 30 Jun 2024 / Consolidated, audited | Rs 55,120 cr | Rs 20.26 | n/a | n/a | Filing |
| Q4 FY24ended 31 Mar 2024 / Consolidated, audited | Rs 67,079 cr | Rs 31.98 | n/a | n/a | Filing |
| Q3 FY24ended 31 Dec 2023 / Consolidated, audited | Rs 55,128 cr | Rs 21.44 | n/a | n/a | Filing |
| Q2 FY24ended 30 Sep 2023 / Consolidated, audited | Rs 51,024 cr | Rs 22.94 | n/a | n/a | Filing |
| Q1 FY24ended 30 Jun 2023 / Consolidated, audited | Rs 47,882 cr | Rs 17.74 | n/a | n/a | Filing |
| Q4 FY23ended 31 Mar 2023 / Consolidated, audited | Rs 58,335 cr | Rs 28.37 | n/a | n/a | Filing |
| Q3 FY23ended 31 Dec 2022 / Consolidated, audited | Rs 46,390 cr | Rs 18.17 | n/a | n/a | Filing |
| Q2 FY23ended 30 Sep 2022 / Consolidated, audited | Rs 42,763 cr | Rs 15.86 | n/a | n/a | Filing |
| Q1 FY23ended 30 Jun 2022 / Consolidated, audited | Rs 35,853 cr | Rs 12.11 | n/a | n/a | Filing |
| Q4 FY22ended 31 Mar 2022 / Consolidated, audited | Rs 52,851 cr | Rs 25.77 | n/a | n/a | Filing |
| Q3 FY22ended 31 Dec 2021 / Consolidated, audited | Rs 39,563 cr | Rs 14.63 | n/a | n/a | Filing |
| Q2 FY22ended 30 Sep 2021 / Consolidated, audited | Rs 34,773 cr | Rs 12.95 | n/a | n/a | Filing |
| Q1 FY22ended 30 Jun 2021 / Consolidated, audited | Rs 29,335 cr | Rs 8.36 | n/a | n/a | Filing |
| Q4 FY21ended 31 Mar 2021 / Consolidated, audited | Rs 48,088 cr | Rs 23.45 | n/a | n/a | Filing |
| Q3 FY21ended 31 Dec 2020 / Consolidated, audited | Rs 35,596 cr | Rs 17.57 | n/a | n/a | Filing |
| Q2 FY21ended 30 Sep 2020 / Consolidated, audited | Rs 31,035 cr | Rs 39.32 | n/a | n/a | Filing |
| Q1 FY21ended 30 Jun 2020 / Consolidated, audited | Rs 21,260 cr | Rs 2.16 | n/a | n/a | Filing |
| Q4 FY20ended 31 Mar 2020 / Consolidated, audited | Rs 44,245 cr | Rs 22.78 | n/a | n/a | Filing |
| Q3 FY20ended 31 Dec 2019 / Consolidated, audited | Rs 36,243 cr | Rs 16.76 | n/a | n/a | Filing |
| Q2 FY20ended 30 Sep 2019 / Consolidated, audited | Rs 35,328 cr | Rs 18.01 | n/a | n/a | Filing |
| Q1 FY20ended 30 Jun 2019 / Consolidated, audited | Rs 29,636 cr | Rs 10.50 | n/a | n/a | Filing |
| Q4 FY19ended 31 Mar 2019 / Consolidated, audited | Rs 44,934 cr | Rs 24.37 | n/a | n/a | Filing |
| Q3 FY19ended 31 Dec 2018 / Consolidated, audited | Rs 35,709 cr | Rs 14.56 | n/a | n/a | Filing |
| Q2 FY19ended 30 Sep 2018 / Consolidated, audited | Rs 32,081 cr | Rs 15.91 | n/a | n/a | Filing |
| Q1 FY19ended 30 Jun 2018 / Consolidated, audited | Rs 28,283 cr | Rs 8.67 | n/a | n/a | Filing |
The official financialsFiled to 31 Mar 2026
LARSEN & TOUBRO LIMITED's statements as filed: trailing twelve month P&L, the balance sheet, and the cash engine. Parsed from official XBRL, shown in crore.
Trailing twelve months, on filed quarters
Revenue (TTM)
2,85,874 crNet profit (TTM)
18,954 crEBIT (TTM)
28,825 crProfit before tax (TTM)
25,976 crNet margin (TTM)
6.6%Finance costs (TTM)
2,849 crBalance sheet, as filed 2026-03-31
Total assets
4,52,550 crShareholder equity
1,28,530 crTotal borrowings
1,21,683 crCash and equivalents
15,391 crInventory
9,531 crTrade receivables
60,461 crThe cash engine, latest filed year
Operating cash flow
16,741 crCapex
4,809 crFree cash flow
11,932 crInvesting flow
11,739 crFinancing flow
2,156 crAnnual trail, filed year over filed year
| Year | Revenue | Net profit | Equity | Borrowings | CFO |
|---|---|---|---|---|---|
| FY26 | 2,85,874 cr | 18,954 cr | 1,28,530 cr | 1,21,683 cr | 16,741 cr |
| FY25 | 2,55,734 cr | 15,037 cr | n/a | n/a | 9,161 cr |
| FY24 | 2,21,113 cr | 15,547 cr | 1,02,550 cr | 1,14,040 cr | 18,266 cr |
| FY23 | 1,83,341 cr | 12,531 cr | 1,03,567 cr | 1,18,513 cr | 22,777 cr |
| FY22 | 1,56,521 cr | 10,419 cr | 95,374 cr | 1,23,468 cr | 19,164 cr |
| FY21 | 1,35,979 cr | 12,921 cr | 87,920 cr | 1,32,605 cr | n/a |
Every figure is parsed from LARSEN & TOUBRO LIMITED's official NSE XBRL filings by the BazaarBaazi earnings lab and shown in crore rupees. Display data, not a valuation model input.
Management on record8 earnings calls
Every LT earnings call BazaarBaazi has indexed, latest 31 Jul 2021. Read management in its own words, straight from the filed transcript.
LARSEN & TOUBRO LIMITED earnings calls on record
8 calls since 31 May 2019
Each entry links to the transcript PDF the company filed with the exchange. Primary sources, in management's own words.
What changed94 disclosures
Every recent official filing from LARSEN & TOUBRO LIMITED, straight from the exchange feed, with the BazaarBaazi Event Heat on the disclosure flow.
LARSEN & TOUBRO LIMITED has filed 94 official disclosures recently. The most recent is a Press release dated 31 Jul 2026.
a press release dated July 31, 2026, titled "L&T Energy Hydrocarbon Onshore Signs Six-Year EPC Agreement with Petroleum Development Oman
Larsen & Toubro Limited has submitted to the Exchange, the un-audited financial results for the period ended Jun 30, 2026.
Amalgamation/Merger of L&T Power Development Limited, a wholly owned subsidiary of the Company, with the Company
Resignation of Mr. V. Sukumar Hebbar as Senior Management Personnel of the company w.e.f. July 27, 2026
Board Meeting to be held on 28-Jul-2026 to inter-alia consider and approve the Unaudited Financial results of the Company for the Quarterly ended June 2026
Event Heat is withheld because the reproducible what-changed window is unavailable. Every line above links to its official exchange filing, and the full market desk is at the disclosures hub.
Key fundamentalsEditorial reference
The anchor data BazaarBaazi references when reading the LT chart. Not a substitute for a registered research note.
| Ticker | LT |
|---|---|
| Full name | LARSEN & TOUBRO LIMITED |
| Sector | Construction |
| Index class | LARGE CAP |
| ISIN | INE018A01030 |
| Market-cap band | ~6.1 lakh cr (indicative) |
| Last referenced level | Inside latest show |
| Last session move | Not referenced this cycle |
| Editorial line in | Systematic Read on 21 Jul 2026 |
| Aliases tracked | LT |
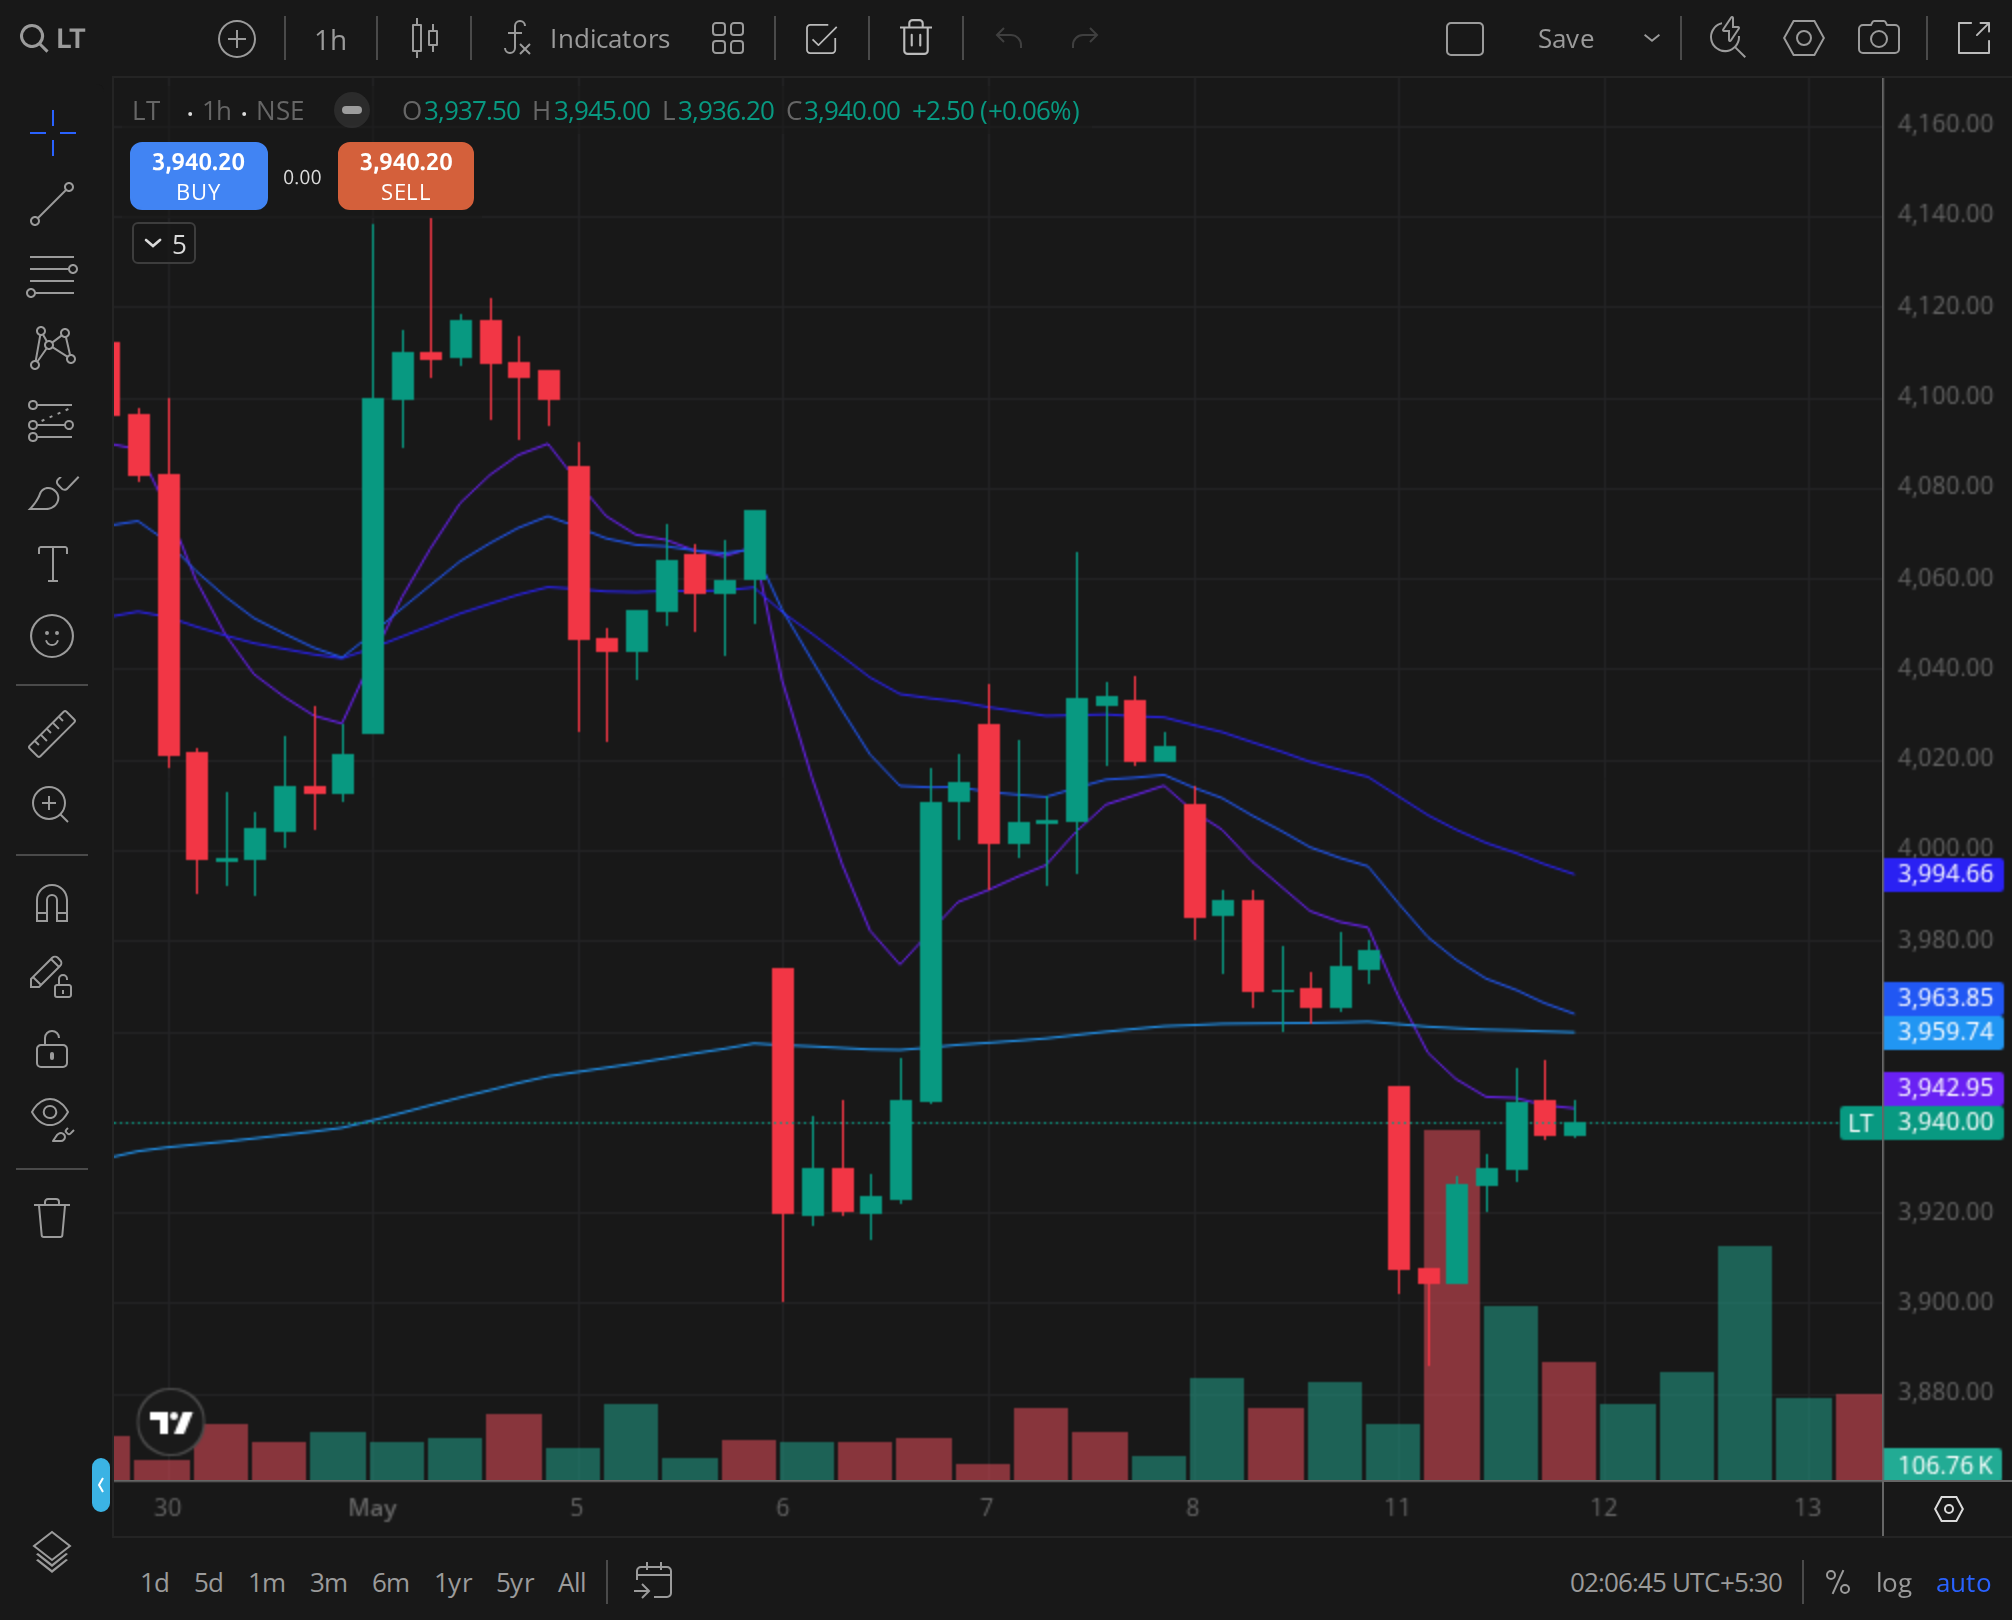
Reference chart24 Mar 2026
The daily frame the desk reads on LT.
FAQ17 reader questions · AEO-eligible
The line on LT, distilled and schema-marked for AI Overview, Perplexity, and reader search.
What is the LT share price target for 2026?
BazaarBaazi does not publish a SEBI-registered price target on LT. The desk reads structural support and resistance inside each show against the printed spot; the most recent editorial line is Systematic Read on 21 Jul 2026.
What is BazaarBaazi's Crack Score for LT?
The BazaarBaazi Crack Score for LT is 43 out of 100 as of 21 Jul 2026, a range / mixed reading. It is a computed conviction number from the signed stance, how consistent the recent verdicts have been, the quality of the printed structure, and how fresh the review is. It is a transparency signal, not investment advice.
What is the F&O view on LT?
Strike-level option inventory for LT is unavailable, so BazaarBaazi withholds participant, direction and positioning claims. The editorial chart stance is not substituted for an option-chain observation.
What sector is LT in and which peers does BazaarBaazi track?
LT sits in Construction (large cap), indicative market cap ~6.1 lakh cr (indicative), ISIN INE018A01030. The peers BazaarBaazi reads alongside it are Cemindia Projects Limited (formerly ITD Cementation India Limited), RAIL VIKAS NIGAM LIMITED, KEC International Limited. A systematic, data-only read on LARSEN & TOUBRO LIMITED: where it trades versus its 50-day and 200-day lines, the live 52-week range, and momentum, refreshed from the scanner's real price series each run.
How often is the LT view updated?
This page is one evergreen URL refreshed in place. The Crack Score and levels re-compute on every BazaarBaazi end-of-day run, and the dated stamp shows the last refresh. The latest signed verdict on LT is bearish, published in Systematic Read on 21 Jul 2026.
Is Larsen and Toubro a good long-term stock?
What drives this name is order inflow converting into executed revenue at decent margins across the infrastructure capex cycle, and the risk the Crack Score cannot fully capture is that competitive bidding can hollow out project profitability even as the order book swells. The Crack Score on this page gives the current read on order pipeline health and margin trajectory.
What is the LT share price target for 2030?
A 2030 figure assumes the infrastructure capex cycle, order inflow and IT-subsidiary growth all hold their pace for years, which is exactly the kind of multi-variable bet no single number captures honestly. The Crack Score reflects the current structural balance between those growth drivers and execution risk.
Why is LT share price falling?
The triggers worth respecting are an order-inflow guidance miss or signs of margin pressure in execution; a broad capital-goods de-rating or capex-slowdown fear is usually the noisier, more transient kind. Check whether the order book is still growing before concluding that the structural case has changed.
Is LT a qualifying setup on the BazaarBaazi scanner right now?
On the 2026-07-31 run of the 500-name BazaarBaazi setup scanner, LARSEN & TOUBRO LIMITED sits in the Scanned tier with a setup score of 61/100 (technical 79, fundamental 33). The scanner is a deterministic engine over real OHLCV and official filings, refreshed nightly, and it is a signal rather than investment advice.
Where can I read LARSEN & TOUBRO LIMITED's earnings call transcripts?
BazaarBaazi indexes 8 LT earnings calls going back to 2019-05-31, latest 2021-07-31. Every entry on this page links straight to the transcript PDF the company filed with the exchange, so you read management in the primary source.
What was LARSEN & TOUBRO LIMITED's Q4 FY26 net profit?
LARSEN & TOUBRO LIMITED reported a net profit of Rs 6,133 cr for Q4 FY26 (the quarter ended 31 March 2026). The figure is from the company's official NSE filing.
What was LARSEN & TOUBRO LIMITED's Q4 FY26 revenue?
LARSEN & TOUBRO LIMITED reported revenue of Rs 82,762 cr for Q4 FY26. The figure is from the company's official NSE filing.
How does BazaarBaazi rate LARSEN & TOUBRO LIMITED's Q4 FY26 result?
BazaarBaazi gives LARSEN & TOUBRO LIMITED's Q4 FY26 result a Result Pulse of 0 out of 100, with a verdict of Insufficient data. The Result Pulse is a BazaarBaazi editorial score for the quality of the filed result, not investment advice.
What has Larsen & Toubro Ltd announced recently?
Larsen & Toubro Ltd's two most material recent disclosures are a press release dated 31 Jul 2026, "L&T Energy Hydrocarbon Onshore Signs Six-Year EPC…", and a disclosure dated 30 Jul 2026, "Bagging/Receiving of orders/contracts". Both link to the company's own official filing on the BazaarBaazi stock page.
Has Larsen & Toubro Ltd declared a dividend recently?
Yes. Larsen & Toubro Ltd filed a dividend disclosure on 22 May 2026, filed as "Dividend - Rs 38 Per Share". Any amount shown is the exchange's own record, linked from the BazaarBaazi stock page. A dividend is a declared payout, not a forecast of future returns.
What did Larsen & Toubro Ltd's latest board meeting cover?
Larsen & Toubro Ltd's most recent board-meeting disclosure on record dated 28 Jul 2026 reads "Board Meeting to be held on 28-Jul-2026 to inter-alia consider and…". That is the agenda as filed with the exchange, linked from the BazaarBaazi stock page, and BazaarBaazi adds no claim of its own to it.
Has Larsen & Toubro Ltd's credit rating been updated recently?
Larsen & Toubro Ltd filed a credit-rating disclosure on 27 Jul 2026, recorded with the exchange as "Regulation 30 of the SEBI (Listing Obligations and Disclosure Requirements)…". The detail sits in the linked filing on the BazaarBaazi stock page. A rating action is an agency view on debt, separate from the share price.
Related stock views
The names BazaarBaazi reads alongside LT, each a living view refreshed every end-of-day run.
Hub
All stock views
The full BazaarBaazi coverage universe, scored and dated.
Construction
CEMPRO
Cemindia Projects Limited (formerly ITD Cementation India Limited)
Construction
RVNL
RAIL VIKAS NIGAM LIMITED
Construction
KEC
KEC International Limited
Construction
AFCONS
Afcons Infrastructure Limited
Construction
ENGINERSIN
Engineers India Limited