Stock · INDIGO · Services
INDIGO share price target 2026
Support, resistance, the F&O structure and the BazaarBaazi Crack Score for INTERGLOBE AVIATION LIMITED, refreshed every end-of-day run. A systematic, data-only read on INTERGLOBE AVIATION LIMITED: where it trades versus its 50-day and 200-day lines, the live 52-week range, and momentum, refreshed from the scanner's real price series each run.
The verdict
BazaarBaazi reads INDIGO as constructive with a Crack Score of 87/100 as of 21 Jul 2026.
BazaarBaaziSource & method
The scanner's readScanned · scanned 31 Jul 2026
Where INDIGO stands on the 500-name BazaarBaazi setup scanner: technicals, filed fundamentals and money flow read together, refreshed every run.
Scanned and scored this run, but the evidence is incomplete or conflicted. The engine fails closed to NO_TRADE.
Technical axis
100/100Fundamental axis
25/100Money flow
62/100Result pulse · Q4 FY26
12/100Technical evidence
price above 50DMA
price above 150DMA
price above 200DMA
200DMA rising
uptrend frame (50 > 200 DMA)
50DMA rising
pulled back to a rising MA
RSI 50.8 (cooled, not broken)
Red flags
above 200DMA (not a confirmed short-side trend)
profit collapse (-182.7% YoY)
weak filed result (score 12.0)
Relative valuation
P/E (TTM)
74.6P/E vs sector
+2.6%Sector percentile
85PEG
n/aScanner levels from the deterministic engine run of 2026-07-31, not a SEBI-registered recommendation and not investment advice. The fundamental axis reads the official filing: Q4 FY26 result.
Price target: support and resistanceComputed 21 Jul 2026
Support and resistance for INDIGO are read inside the latest show; no spot was printed in the most recent editorial note.
Levels are read inside the latest show. The most recent editorial reference is Systematic Read on 21 Jul 2026.
These are structural reference lines, not a SEBI-registered price target. BazaarBaazi is independent media; the levels frame how the desk reads the INDIGO chart, refreshed every end-of-day run.
The Crack Score, and how it is built87 / 100 · High conviction
The Crack Score is a deterministic 0 to 100 conviction number. Here is exactly what moved it for INDIGO, so the figure is a transparent signal rather than a vibe.
Base 50, adjusted by the factors above and clamped to 0 to 100. How the Crack Score works.
The F&O viewHorizon · swing
How the futures and options structure on INDIGO reads right now.
The editorial price read on INDIGO is bullish. Strike-level option inventory is unavailable, so the page withholds writer, wall and pin claims. Single-stock F&O on INDIGO can be thinner than index F&O, so the desk weights price and filed evidence over raw OI. This is not a derivatives trade recommendation.
Why it movedLatest editorial line
The most recent BazaarBaazi read on what is driving INDIGO.
Systematic read: a disclosed, data-only model on real 1-year price structure.
Read in Systematic Read on 21 Jul 2026. Why INDIGO moved, the living explainer, tracks every move on one URL.
Latest filed resultsQ4 FY26
INTERGLOBE AVIATION LIMITED's most recent quarter, parsed straight from the official NSE filing. Every figure links back to its primary source.
Result Pulse
12 / 100Revenue
Rs 22,438 crNet profit
Rs -2,537 crEPS (quarter)
Rs -65.62| Growth | YoY | QoQ |
|---|---|---|
| Revenue | +1.3% | -4.4% |
| Net profit | -182.7% | -562.0% |
| Net margin | -11.3% | |
Distorted by a prior-year base effect.
Figures are the Q4 FY26 result for INTERGLOBE AVIATION LIMITED, parsed straight from the official NSE integrated filing and verified to the paisa. The EPS shown is for the quarter, not a trailing-twelve-month figure, so it is not a P/E input.
Earnings history, every filed quarter32 quarters on record
INTERGLOBE AVIATION LIMITED's official quarterly revenue, EPS and Result Pulse trail, every quarter the desk holds from the verified filings export, back to 30 Jun 2018. These are quarterly facts, not TTM valuation inputs.
INDIGO official result trail
32 quarters
Quarterly figures only: revenue, net profit and EPS are copied from official filings. EPS here is not trailing twelve month EPS and is not used for valuation.
| Quarter | Revenue | EPS | PAT YoY | Pulse | Source |
|---|---|---|---|---|---|
| Q4 FY26ended 31 Mar 2026 / Consolidated, audited | Rs 22,438 cr | Rs 65.62 | n/a | n/a | Filing |
| Q3 FY26ended 31 Dec 2025 / Consolidated, audited | Rs 23,472 cr | Rs 14.22 | n/a | 60/100 | Filing |
| Q2 FY26ended 30 Sep 2025 / Consolidated, audited | Rs 18,555 cr | Rs -66.79 | n/a | 32/100 | Filing |
| Q1 FY26ended 30 Jun 2025 / Consolidated, audited | Rs 20,496 cr | Rs 56.31 | n/a | 50/100 | Filing |
| Q4 FY25ended 31 Mar 2025 / Consolidated, audited | Rs 22,152 cr | Rs 79.38 | n/a | n/a | Filing |
| Q3 FY25ended 31 Dec 2024 / Consolidated, audited | Rs 22,111 cr | Rs 63.38 | n/a | n/a | Filing |
| Q2 FY25ended 30 Sep 2024 / Consolidated, audited | Rs 16,970 cr | Rs -25.55 | n/a | n/a | Filing |
| Q1 FY25ended 30 Jun 2024 / Consolidated, audited | Rs 19,571 cr | Rs 70.70 | n/a | n/a | Filing |
| Q4 FY24ended 31 Mar 2024 / Consolidated, audited | Rs 17,825 cr | Rs 49.09 | n/a | n/a | Filing |
| Q3 FY24ended 31 Dec 2023 / Consolidated, audited | Rs 19,452 cr | Rs 77.69 | n/a | n/a | Filing |
| Q2 FY24ended 30 Sep 2023 / Consolidated, audited | Rs 14,944 cr | Rs 4.90 | n/a | n/a | Filing |
| Q1 FY24ended 30 Jun 2023 / Consolidated, audited | Rs 16,683 cr | Rs 80.16 | n/a | n/a | Filing |
| Q4 FY23ended 31 Mar 2023 / Consolidated, audited | Rs 14,161 cr | Rs 23.84 | n/a | n/a | Filing |
| Q3 FY23ended 31 Dec 2022 / Consolidated, audited | Rs 14,933 cr | Rs 36.91 | n/a | n/a | Filing |
| Q2 FY23ended 30 Sep 2022 / Consolidated, audited | Rs 12,498 cr | Rs -41.09 | n/a | n/a | Filing |
| Q1 FY23ended 30 Jun 2022 / Consolidated, audited | Rs 12,855 cr | Rs -27.64 | n/a | n/a | Filing |
| Q4 FY22ended 31 Mar 2022 / Consolidated, audited | Rs 8,021 cr | Rs -43.66 | n/a | n/a | Filing |
| Q3 FY22ended 31 Dec 2021 / Consolidated, audited | Rs 9,295 cr | Rs 3.37 | n/a | n/a | Filing |
| Q2 FY22ended 30 Sep 2021 / Consolidated, audited | Rs 5,609 cr | Rs -37.29 | n/a | n/a | Filing |
| Q1 FY22ended 30 Jun 2021 / Consolidated, audited | Rs 3,007 cr | Rs -82.47 | n/a | n/a | Filing |
| Q4 FY21ended 31 Mar 2021 / Consolidated, audited | Rs 6,223 cr | Rs -29.81 | n/a | n/a | Filing |
| Q3 FY21ended 31 Dec 2020 / Consolidated, audited | Rs 4,910 cr | Rs -16.11 | n/a | n/a | Filing |
| Q2 FY21ended 30 Sep 2020 / Consolidated, audited | Rs 2,741 cr | Rs -31.05 | n/a | n/a | Filing |
| Q1 FY21ended 30 Jun 2020 / Consolidated, audited | Rs 767 cr | Rs -73.92 | n/a | n/a | Filing |
| Q4 FY20ended 31 Mar 2020 / Consolidated, audited | Rs 8,299 cr | Rs -22.63 | n/a | n/a | Filing |
| Q3 FY20ended 31 Dec 2019 / Consolidated, audited | Rs 9,932 cr | Rs 12.89 | n/a | n/a | Filing |
| Q2 FY20ended 30 Sep 2019 / Consolidated, audited | Rs 8,105 cr | Rs -27.61 | n/a | n/a | Filing |
| Q1 FY20ended 30 Jun 2019 / Consolidated, audited | Rs 9,420 cr | Rs 31.29 | n/a | n/a | Filing |
| Q4 FY19ended 31 Mar 2019 / Standalone, audited | Rs 7,883 cr | Rs 15.34 | n/a | n/a | Filing |
| Q3 FY19ended 31 Dec 2018 / Standalone, audited | Rs 7,916 cr | Rs 4.97 | n/a | n/a | Filing |
| Q2 FY19ended 30 Sep 2018 / Standalone, audited | Rs 6,185 cr | Rs -16.96 | n/a | n/a | Filing |
| Q1 FY19ended 30 Jun 2018 / Standalone, audited | Rs 6,512 cr | Rs 0.72 | n/a | n/a | Filing |
The official financialsFiled to 31 Mar 2026
INTERGLOBE AVIATION LIMITED's statements as filed: trailing twelve month P&L, the balance sheet, and the cash engine. Parsed from official XBRL, shown in crore.
Trailing twelve months, on filed quarters
Revenue (TTM)
84,962 crNet profit (TTM)
-2,394 crEBIT (TTM)
3,930 crProfit before tax (TTM)
-1,961 crNet margin (TTM)
-2.8%Finance costs (TTM)
5,891 crBalance sheet, as filed 2026-03-31
Total assets
1,36,002 crShareholder equity
6,987 crTotal borrowings
1,806 crCash and equivalents
1,324 crInventory
985 crTrade receivables
600 crThe cash engine, latest filed year
Operating cash flow
23,470 crCapex
2,272 crFree cash flow
21,198 crInvesting flow
-1,953 crFinancing flow
-21,276 crAnnual trail, filed year over filed year
| Year | Revenue | Net profit | Equity | Borrowings | CFO |
|---|---|---|---|---|---|
| FY26 | 84,962 cr | -2,394 cr | 6,987 cr | 1,806 cr | 23,470 cr |
| FY25 | 80,803 cr | 7,258 cr | 9,368 cr | 1,800 cr | 24,151 cr |
| FY24 | 68,904 cr | 8,172 cr | 1,996 cr | 1,892 cr | 21,218 cr |
| FY23 | 54,446 cr | -306 cr | -6,247 cr | 2,252 cr | 12,728 cr |
| FY22 | 25,931 cr | -6,162 cr | -5,988 cr | 3,897 cr | 2,091 cr |
| FY21 | 14,641 cr | -5,806 cr | 111 cr | 2,506 cr | n/a |
Every figure is parsed from INTERGLOBE AVIATION LIMITED's official NSE XBRL filings by the BazaarBaazi earnings lab and shown in crore rupees. Display data, not a valuation model input.
Management on record29 earnings calls
Every INDIGO earnings call BazaarBaazi has indexed, latest 30 Jun 2026. Read management in its own words, straight from the filed transcript.
INTERGLOBE AVIATION LIMITED earnings calls on record
29 calls since 31 Jul 2019
Show 21 older calls
Each entry links to the transcript PDF the company filed with the exchange. Primary sources, in management's own words.
What changed2 disclosures
Every recent official filing from INTERGLOBE AVIATION LIMITED, straight from the exchange feed, with the BazaarBaazi Event Heat on the disclosure flow.
INTERGLOBE AVIATION LIMITED has filed 2 official disclosures recently. The most recent is a Earnings dated 31 Mar 2026.
Event Heat is withheld because the reproducible what-changed window is unavailable. Every line above links to its official exchange filing, and the full market desk is at the disclosures hub.
Key fundamentalsEditorial reference
The anchor data BazaarBaazi references when reading the INDIGO chart. Not a substitute for a registered research note.
| Ticker | INDIGO |
|---|---|
| Full name | INTERGLOBE AVIATION LIMITED |
| Sector | Services |
| Index class | LARGE CAP |
| ISIN | INE646L01027 |
| Market-cap band | ~2.1 lakh cr (indicative) |
| Last referenced level | Inside latest show |
| Last session move | Not referenced this cycle |
| Editorial line in | Systematic Read on 21 Jul 2026 |
| Aliases tracked | INDIGO |
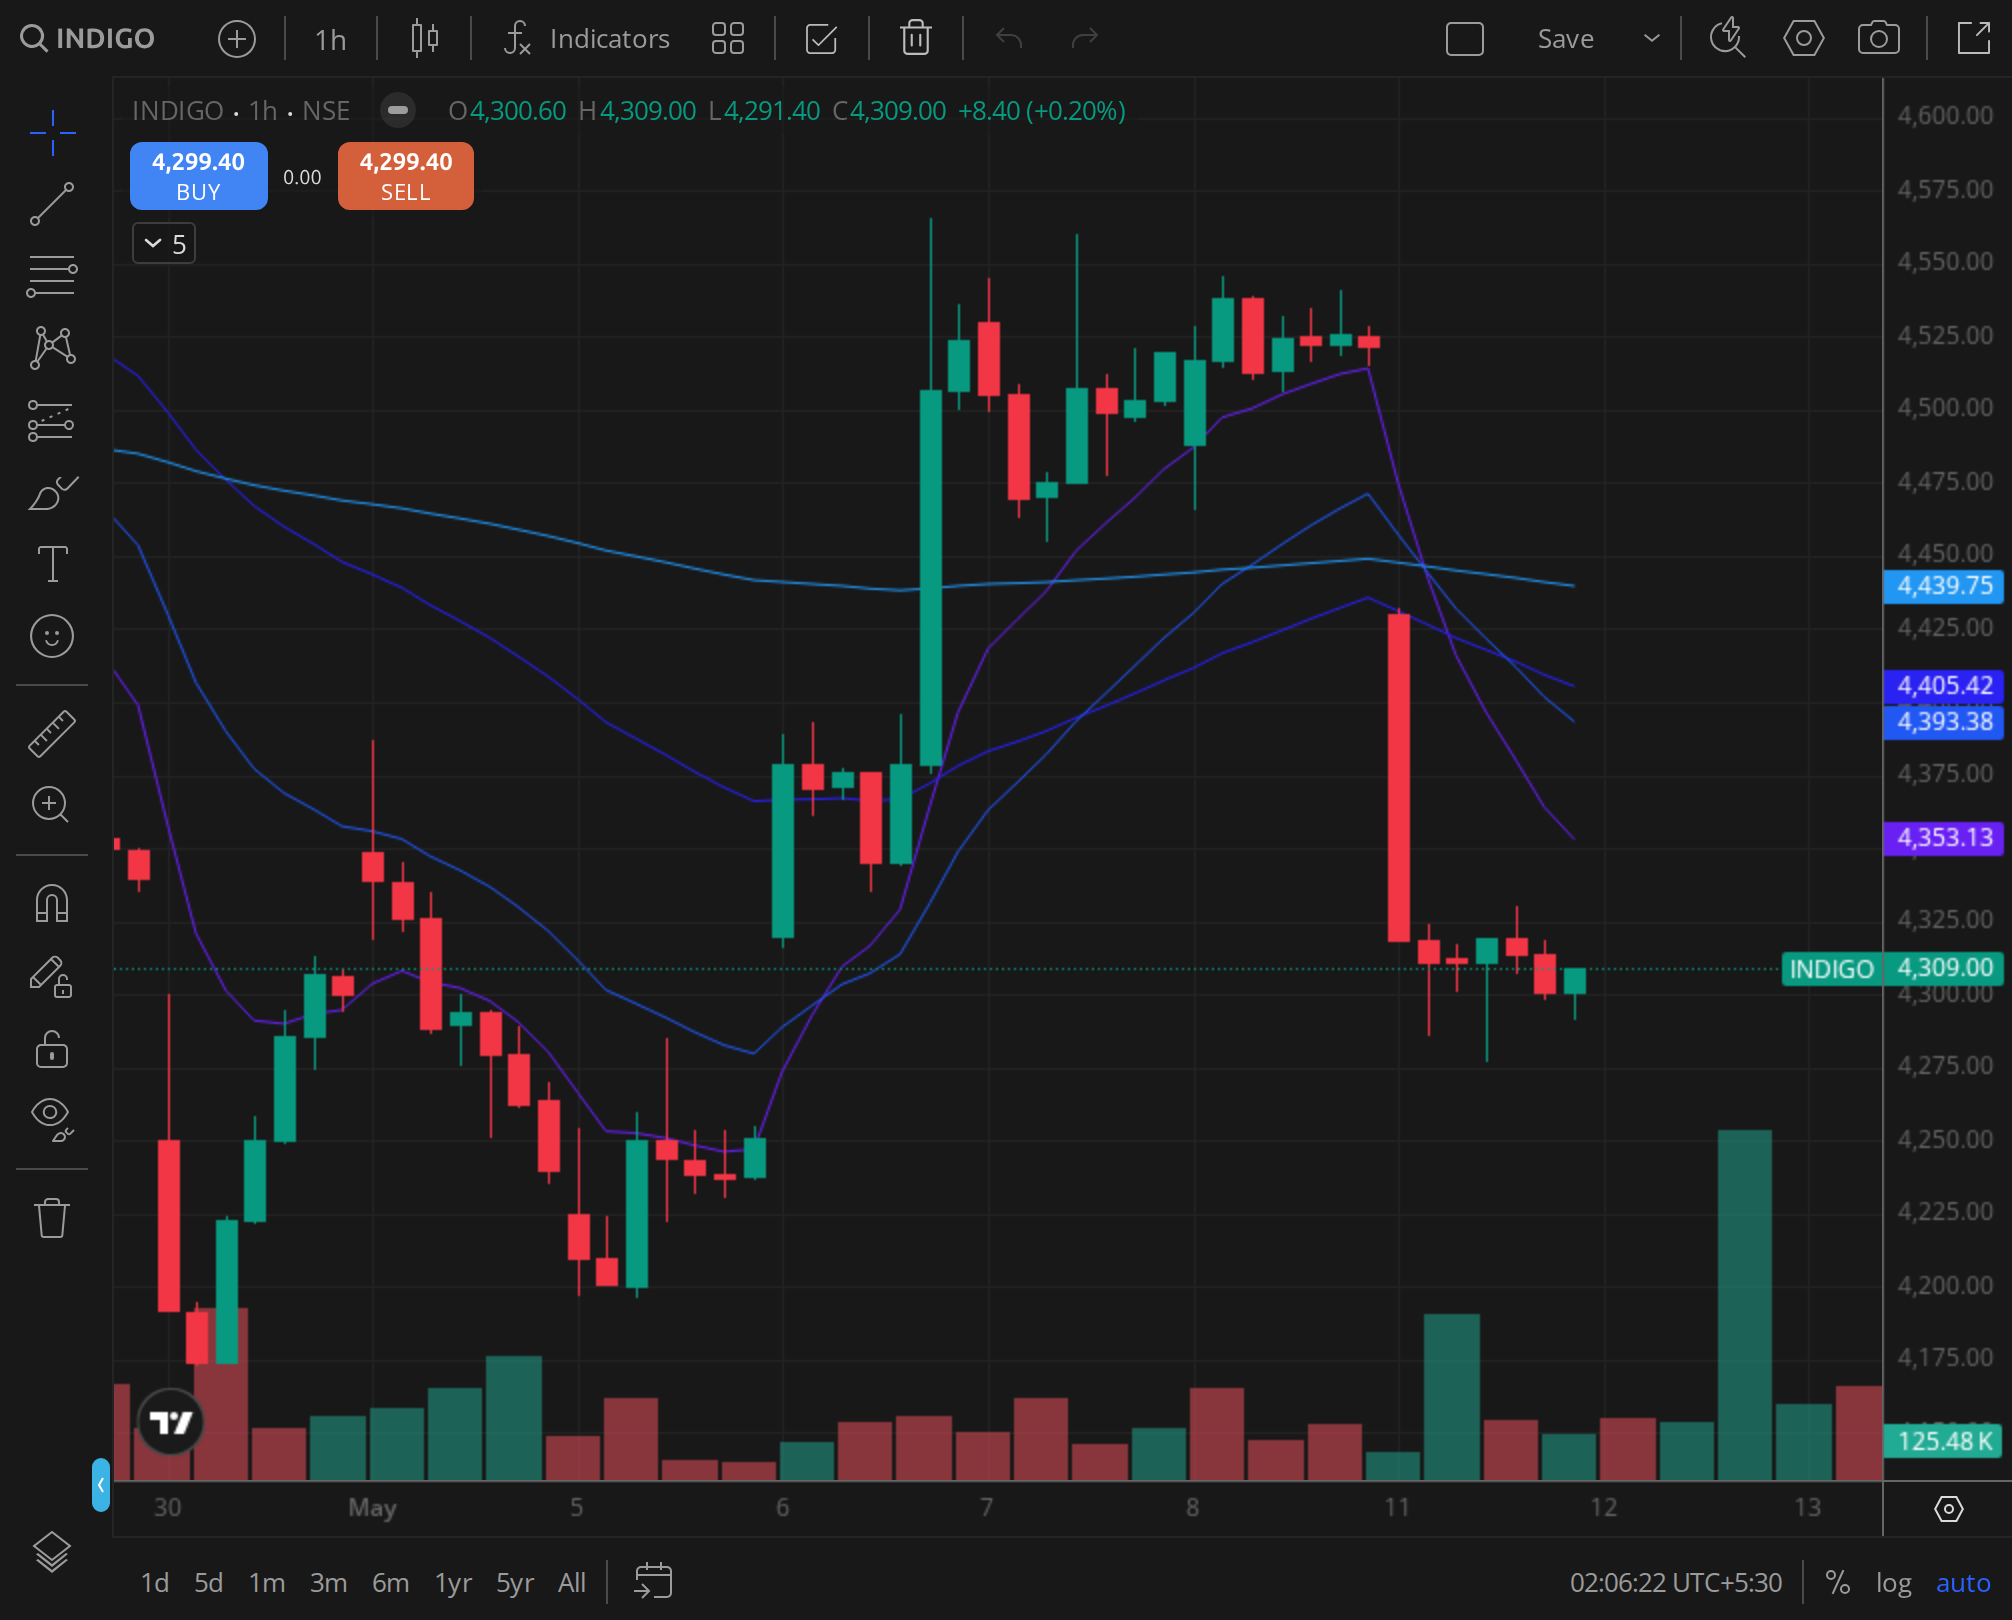
Reference chart29 Apr 2025
The daily frame the desk reads on INDIGO.
FAQ11 reader questions · AEO-eligible
The line on INDIGO, distilled and schema-marked for AI Overview, Perplexity, and reader search.
What is the INDIGO share price target for 2026?
BazaarBaazi does not publish a SEBI-registered price target on INDIGO. The desk reads structural support and resistance inside each show against the printed spot; the most recent editorial line is Systematic Read on 21 Jul 2026.
What is BazaarBaazi's Crack Score for INDIGO?
The BazaarBaazi Crack Score for INDIGO is 87 out of 100 as of 21 Jul 2026, a high conviction reading. It is a computed conviction number from the signed stance, how consistent the recent verdicts have been, the quality of the printed structure, and how fresh the review is. It is a transparency signal, not investment advice.
What is the F&O view on INDIGO?
Strike-level option inventory for INDIGO is unavailable, so BazaarBaazi withholds participant, direction and positioning claims. The editorial chart stance is not substituted for an option-chain observation.
What sector is INDIGO in and which peers does BazaarBaazi track?
INDIGO sits in Services (large cap), indicative market cap ~2.1 lakh cr (indicative), ISIN INE646L01027. The peers BazaarBaazi reads alongside it are ECLERX SERVICES LIMITED, GMR AIRPORTS LIMITED, DELHIVERY LIMITED. A systematic, data-only read on INTERGLOBE AVIATION LIMITED: where it trades versus its 50-day and 200-day lines, the live 52-week range, and momentum, refreshed from the scanner's real price series each run.
How often is the INDIGO view updated?
This page is one evergreen URL refreshed in place. The Crack Score and levels re-compute on every BazaarBaazi end-of-day run, and the dated stamp shows the last refresh. The latest signed verdict on INDIGO is bullish, published in Systematic Read on 21 Jul 2026.
Is INDIGO a qualifying setup on the BazaarBaazi scanner right now?
On the 2026-07-31 run of the 500-name BazaarBaazi setup scanner, INTERGLOBE AVIATION LIMITED sits in the Scanned tier with a setup score of 68/100 (technical 100, fundamental 25). The scanner is a deterministic engine over real OHLCV and official filings, refreshed nightly, and it is a signal rather than investment advice.
Where can I read INTERGLOBE AVIATION LIMITED's earnings call transcripts?
BazaarBaazi indexes 29 INDIGO earnings calls going back to 2019-07-31, latest 2026-06-30. Every entry on this page links straight to the transcript PDF the company filed with the exchange, so you read management in the primary source.
What was INTERGLOBE AVIATION LIMITED's Q4 FY26 net profit?
INTERGLOBE AVIATION LIMITED reported a net profit of Rs -2,537 cr for Q4 FY26 (the quarter ended 31 March 2026). That is -182.7% year on year, a move distorted by a prior-year base effect. The figure is from the company's official NSE filing.
What was INTERGLOBE AVIATION LIMITED's Q4 FY26 revenue?
INTERGLOBE AVIATION LIMITED reported revenue of Rs 22,438 cr for Q4 FY26. That is +1.3% year on year. The figure is from the company's official NSE filing.
How does BazaarBaazi rate INTERGLOBE AVIATION LIMITED's Q4 FY26 result?
BazaarBaazi gives INTERGLOBE AVIATION LIMITED's Q4 FY26 result a Result Pulse of 12 out of 100, with a verdict of Weak. The Result Pulse is a BazaarBaazi editorial score for the quality of the filed result, not investment advice.
What has Interglobe Aviation Ltd announced recently?
The most recent official filing on record for Interglobe Aviation Ltd is an earnings dated 31 Mar 2026. It is the company's own earnings disclosure to the exchange, and it links to that filing on the BazaarBaazi stock page rather than to any third-party summary.
Related stock views
The names BazaarBaazi reads alongside INDIGO, each a living view refreshed every end-of-day run.