Stock · HINDALCO · Metals & Mining
HINDALCO share price target 2026
Support, resistance, the F&O structure and the BazaarBaazi Crack Score for HINDALCO INDUSTRIES LIMITED, refreshed every end-of-day run. A systematic, data-only read on HINDALCO INDUSTRIES LIMITED: where it trades versus its 50-day and 200-day lines, the live 52-week range, and momentum, refreshed from the scanner's real price series each run.
The verdict
BazaarBaazi reads HINDALCO as two-way with a Crack Score of 76/100 as of 21 Jul 2026.
BazaarBaaziSource & method
The scanner's readScanned · scanned 31 Jul 2026
Where HINDALCO stands on the 500-name BazaarBaazi setup scanner: technicals, filed fundamentals and money flow read together, refreshed every run.
Scanned and scored this run, but the evidence is incomplete or conflicted. The engine fails closed to NO_TRADE.
Technical axis
100/100Fundamental axis
67/100Money flow
37/100Result pulse · Q4 FY26
52/100Technical evidence
RS slope -7.2% (3m)
RS line well below its high
relative strength falling vs NIFTY
below 50DMA
Fundamental evidence
net profit -50.85% YoY
profit down at least 20% YoY
YoY growth not accelerating
net margin 3.32% (thin)
Red flags
above 200DMA (not a confirmed short-side trend)
profit collapse (-50.85% YoY)
Relative valuation
P/E (TTM)
16.1P/E vs sector
+0.8%Sector percentile
22PEG
n/aScanner levels from the deterministic engine run of 2026-07-31, not a SEBI-registered recommendation and not investment advice. The fundamental axis reads the official filing: Q4 FY26 result.
Price target: support and resistanceComputed 21 Jul 2026
Support and resistance for HINDALCO are read inside the latest show; no spot was printed in the most recent editorial note.
Levels are read inside the latest show. The most recent editorial reference is Systematic Read on 21 Jul 2026.
These are structural reference lines, not a SEBI-registered price target. BazaarBaazi is independent media; the levels frame how the desk reads the HINDALCO chart, refreshed every end-of-day run.
The Crack Score, and how it is built76 / 100 · High conviction
The Crack Score is a deterministic 0 to 100 conviction number. Here is exactly what moved it for HINDALCO, so the figure is a transparent signal rather than a vibe.
Base 50, adjusted by the factors above and clamped to 0 to 100. How the Crack Score works.
About HINDALCO INDUSTRIES LIMITEDBusiness profile
What HINDALCO actually does, and the edge that holds its position.
Hindalco is the one Indian metals name where the headline asset sits abroad: its US subsidiary Novelis, the world's leading maker of rolled aluminium for autos, beverage cans and specialty packaging, is what separates it from a plain commodity smelter. At home it runs integrated aluminium smelters with captive coal and bauxite in Odisha and Chhattisgarh plus a copper smelting business at Birla Copper in Gujarat. Novelis adds a recycling-led, value-added layer through plants across North America, South America, Europe and Asia, turning a cyclical Indian metals play into a geared bet on global aluminium demand.
Hindalco's structural edge in India is vertical integration from bauxite mining through smelting and fabrication, reducing spot raw-material exposure. Novelis's edge is its leading position in automotive aluminium sheet, a segment benefiting from lightweighting and EV adoption, combined with high recycled-content operations that are increasingly preferred by automotive OEMs committed to sustainability targets.
The F&O viewHorizon · swing
How the futures and options structure on HINDALCO reads right now.
The editorial price read on HINDALCO is mixed. Strike-level option inventory is unavailable, so the page withholds writer, wall and pin claims. Single-stock F&O on HINDALCO can be thinner than index F&O, so the desk weights price and filed evidence over raw OI. This is not a derivatives trade recommendation.
Why it movedLatest editorial line
The most recent BazaarBaazi read on what is driving HINDALCO.
Systematic read: a disclosed, data-only model on real 1-year price structure.
Read in Systematic Read on 21 Jul 2026. Why HINDALCO moved, the living explainer, tracks every move on one URL.
The 2026 to 2030 pictureStructural read
What genuinely drives HINDALCO over a multi-year horizon. A structural read, not a price forecast.
Over 2026 to 2030 Novelis is the swing factor: EV adoption in the automotive sector accelerates demand for aluminium sheet (used in body panels, battery enclosures and structural parts), and Novelis is positioned at the front of that shift. In India, aluminium demand is tied to the power sector, packaging and construction. The key risk is aluminium price cycles and energy costs at smelters, which move with coal and power prices. WHAT BAZAARBAAZI THINKS: Novelis is what you are really paying up for, because its auto-sheet franchise rides EV lightweighting in a way no Indian smelter can; the catch the Crack Score cannot fully price is that the upstream smelters still leave you exposed to the LME aluminium price and to power costs, so a soft metal cycle or a coal-price spike can mug the commodity half even while the Novelis story stays intact.
What to watch:
- Novelis EBITDA per tonne and auto-can mix as the value-add signal
- London Metal Exchange aluminium price as the revenue baseline
- India smelter power cost relative to tariff and captive coal availability
- EV model launches by key automotive customers of Novelis
- Novelis recycled-content percentage as the sustainability-premium signal
Peers and how to compare4 listed names
The listed names HINDALCO is most often read against. Compare them on the same Crack Score and levels.
Tata Steel (diversified metals peer) · TATASTEEL
Read the TATASTEEL verdict and levels
JSW Steel (metals peer) · JSWSTEEL
Read the JSWSTEEL verdict and levels
Nalco (state-owned aluminium, listed)
Listed peer in the same space
Vedanta (aluminium and diversified metals)
Listed peer in the same space
Stored valuation readStored 2026-10-19
P/E, P/B, yield and the quality set for HINDALCO INDUSTRIES LIMITED, computed only from the stored fundamentals snapshot dated 2026-10-19. No carried market price is presented as current.
P / E
12.2x
Earnings yield
8.19%
P / B
1.46x
P / S
0.68x
EV / EBITDA
6.7x
Dividend yield
0.56%
Market cap
Rs 2.00 lakh cr
Enterprise value
Rs 2.76 lakh cr
Stored from HINDALCO INDUSTRIES LIMITED's filed results, as of 2026-10-19 and currency-checked. Price input Rs 900.45 from baked EOD spot. Open the calculator, move the price and watch every ratio react.
Latest filed resultsQ4 FY26
HINDALCO INDUSTRIES LIMITED's most recent quarter, parsed straight from the official NSE filing. Every figure links back to its primary source.
Result Pulse
52 / 100Revenue
Rs 78,133 crNet profit
Rs 2,597 crEPS (quarter)
Rs 11.70| Growth | YoY | QoQ |
|---|---|---|
| Revenue | +20.4% | +17.5% |
| Net profit | -50.9% | +26.7% |
| Net margin | +3.3% | |
Figures are the Q4 FY26 result for HINDALCO INDUSTRIES LIMITED, parsed straight from the official NSE integrated filing and verified to the paisa. The EPS shown is for the quarter, not a trailing-twelve-month figure, so it is not a P/E input.
Earnings history, every filed quarter27 quarters on record
HINDALCO INDUSTRIES LIMITED's official quarterly revenue, EPS and Result Pulse trail, every quarter the desk holds from the verified filings export, back to 30 Sep 2018. These are quarterly facts, not TTM valuation inputs.
HINDALCO official result trail
27 quarters
Quarterly figures only: revenue, net profit and EPS are copied from official filings. EPS here is not trailing twelve month EPS and is not used for valuation.
| Quarter | Revenue | EPS | PAT YoY | Pulse | Source |
|---|---|---|---|---|---|
| Q4 FY26ended 31 Mar 2026 / Consolidated, audited | Rs 78,133 cr | Rs 11.70 | n/a | n/a | Filing |
| Q3 FY26ended 31 Dec 2025 / Consolidated, audited | Rs 66,521 cr | Rs 9.23 | n/a | 40/100 | Filing |
| Q2 FY26ended 30 Sep 2025 / Consolidated, audited | Rs 66,058 cr | Rs 21.35 | n/a | n/a | Filing |
| Q1 FY26ended 30 Jun 2025 / Consolidated, audited | Rs 64,232 cr | Rs 18.03 | n/a | 50/100 | Filing |
| Q4 FY25ended 31 Mar 2025 / Consolidated, audited | Rs 64,890 cr | Rs 23.80 | n/a | 50/100 | Filing |
| Q3 FY25ended 31 Dec 2024 / Consolidated, audited | Rs 58,390 cr | Rs 16.82 | n/a | n/a | Filing |
| Q2 FY25ended 30 Sep 2024 / Consolidated, audited | Rs 58,203 cr | Rs 17.59 | n/a | n/a | Filing |
| Q1 FY25ended 30 Jun 2024 / Consolidated, audited | Rs 57,013 cr | Rs 13.84 | n/a | n/a | Filing |
| Q4 FY24ended 31 Mar 2024 / Consolidated, audited | Rs 55,994 cr | Rs 14.29 | n/a | n/a | Filing |
| Q3 FY24ended 31 Dec 2023 / Consolidated, audited | Rs 52,808 cr | Rs 10.50 | n/a | n/a | Filing |
| Q2 FY24ended 30 Sep 2023 / Consolidated, audited | Rs 54,169 cr | Rs 9.88 | n/a | n/a | Filing |
| Q1 FY24ended 30 Jun 2023 / Consolidated, audited | Rs 52,991 cr | Rs 11.05 | n/a | n/a | Filing |
| Q4 FY23ended 31 Mar 2023 / Consolidated, audited | Rs 55,857 cr | Rs 10.85 | n/a | n/a | Filing |
| Q3 FY23ended 31 Dec 2022 / Consolidated, audited | Rs 53,151 cr | Rs 6.13 | n/a | n/a | Filing |
| Q2 FY23ended 30 Sep 2022 / Consolidated, audited | Rs 56,176 cr | Rs 9.92 | n/a | n/a | Filing |
| Q1 FY23ended 30 Jun 2022 / Consolidated, audited | Rs 58,018 cr | Rs 18.52 | n/a | n/a | Filing |
| Q4 FY22ended 31 Mar 2022 / Consolidated, audited | Rs 55,764 cr | Rs 17.31 | n/a | n/a | Filing |
| Q3 FY22ended 31 Dec 2021 / Consolidated, audited | Rs 50,272 cr | Rs 16.53 | n/a | n/a | Filing |
| Q3 FY21ended 31 Dec 2020 / Consolidated, audited | Rs 34,958 cr | Rs 8.44 | n/a | n/a | Filing |
| Q2 FY21ended 30 Sep 2020 / Consolidated, audited | Rs 31,237 cr | Rs 1.74 | n/a | n/a | Filing |
| Q1 FY21ended 30 Jun 2020 / Consolidated, audited | Rs 25,283 cr | Rs -3.19 | n/a | n/a | Filing |
| Q4 FY20ended 31 Mar 2020 / Consolidated, audited | Rs 29,318 cr | Rs 3.01 | n/a | n/a | Filing |
| Q3 FY20ended 31 Dec 2019 / Consolidated, audited | Rs 29,197 cr | Rs 4.77 | n/a | n/a | Filing |
| Q2 FY20ended 30 Sep 2019 / Consolidated, audited | Rs 29,657 cr | Rs 4.38 | n/a | n/a | Filing |
| Q4 FY19ended 31 Mar 2019 / Standalone, audited | Rs 12,373 cr | Rs 1.06 | n/a | n/a | Filing |
| Q3 FY19ended 31 Dec 2018 / Standalone, audited | Rs 11,938 cr | Rs 1.11 | n/a | n/a | Filing |
| Q2 FY19ended 30 Sep 2018 / Standalone, audited | Rs 10,833 cr | Rs 1.38 | n/a | n/a | Filing |
The official financialsFiled to 31 Mar 2026
HINDALCO INDUSTRIES LIMITED's statements as filed: trailing twelve month P&L, the balance sheet, and the cash engine. Parsed from official XBRL, shown in crore.
Trailing twelve months, on filed quarters
Revenue (TTM)
2,74,944 crNet profit (TTM)
13,391 crEBIT (TTM)
21,980 crProfit before tax (TTM)
18,500 crNet margin (TTM)
4.9%Finance costs (TTM)
3,480 crBalance sheet, as filed 2026-03-31
Total assets
3,47,795 crShareholder equity
1,36,595 crTotal borrowings
96,659 crCash and equivalents
14,350 crInventory
75,517 crTrade receivables
27,222 crThe cash engine, latest filed year
Operating cash flow
10,250 crCapex
30,096 crFree cash flow
-19,846 crInvesting flow
-26,583 crFinancing flow
20,087 crAnnual trail, filed year over filed year
| Year | Revenue | Net profit | Equity | Borrowings | CFO |
|---|---|---|---|---|---|
| FY26 | 2,74,944 cr | 13,391 cr | 1,36,595 cr | 96,659 cr | 10,250 cr |
| FY25 | 2,38,496 cr | 16,002 cr | 1,23,721 cr | 61,931 cr | 24,410 cr |
| FY24 | 2,15,962 cr | 10,155 cr | 1,06,157 cr | 54,501 cr | 24,056 cr |
| FY23 | 2,23,202 cr | 10,097 cr | 94,817 cr | 58,335 cr | 19,208 cr |
| FY22 | 1,95,059 cr | 13,730 cr | 78,202 cr | 63,235 cr | 16,838 cr |
| FY20 | 1,18,144 cr | 3,767 cr | 58,327 cr | 67,096 cr | n/a |
Every figure is parsed from HINDALCO INDUSTRIES LIMITED's official NSE XBRL filings by the BazaarBaazi earnings lab and shown in crore rupees. Display data, not a valuation model input.
Management on record17 earnings calls
Every HINDALCO earnings call BazaarBaazi has indexed, latest 31 May 2026. Read management in its own words, straight from the filed transcript.
HINDALCO INDUSTRIES LIMITED earnings calls on record
17 calls since 31 Dec 2021
Show 9 older calls
Each entry links to the transcript PDF the company filed with the exchange. Primary sources, in management's own words.
What changed54 disclosures
Every recent official filing from HINDALCO INDUSTRIES LIMITED, straight from the exchange feed, with the BazaarBaazi Event Heat on the disclosure flow.
HINDALCO INDUSTRIES LIMITED has filed 54 official disclosures recently. The most recent is a Earnings dated 29 Jul 2026.
Intimation of Q1 FY27 Earnings Conference Call of Novelis Inc., wholly owned subsidiary of the Company
Novelis Inc. a wholly owned subsidiary of the Company has announced entry into a Material Definitive Agreement.
Chairman's Speech at the 67th Annual General Meeting of the Company
Newspaper Advertisement(s) regarding Notice of Special Window for Re-lodgement of Transfer Requests of Physical Shares.
Event Heat is withheld because the reproducible what-changed window is unavailable. Every line above links to its official exchange filing, and the full market desk is at the disclosures hub.
Key fundamentalsEditorial reference
The anchor data BazaarBaazi references when reading the HINDALCO chart. Not a substitute for a registered research note.
| Ticker | HINDALCO |
|---|---|
| Full name | HINDALCO INDUSTRIES LIMITED |
| Sector | Metals & Mining |
| Index class | LARGE CAP |
| ISIN | INE038A01020 |
| Market-cap band | ~2.1 lakh cr (indicative) |
| Last referenced level | Inside latest show |
| Last session move | Not referenced this cycle |
| Editorial line in | Systematic Read on 21 Jul 2026 |
| Aliases tracked | HINDALCO |
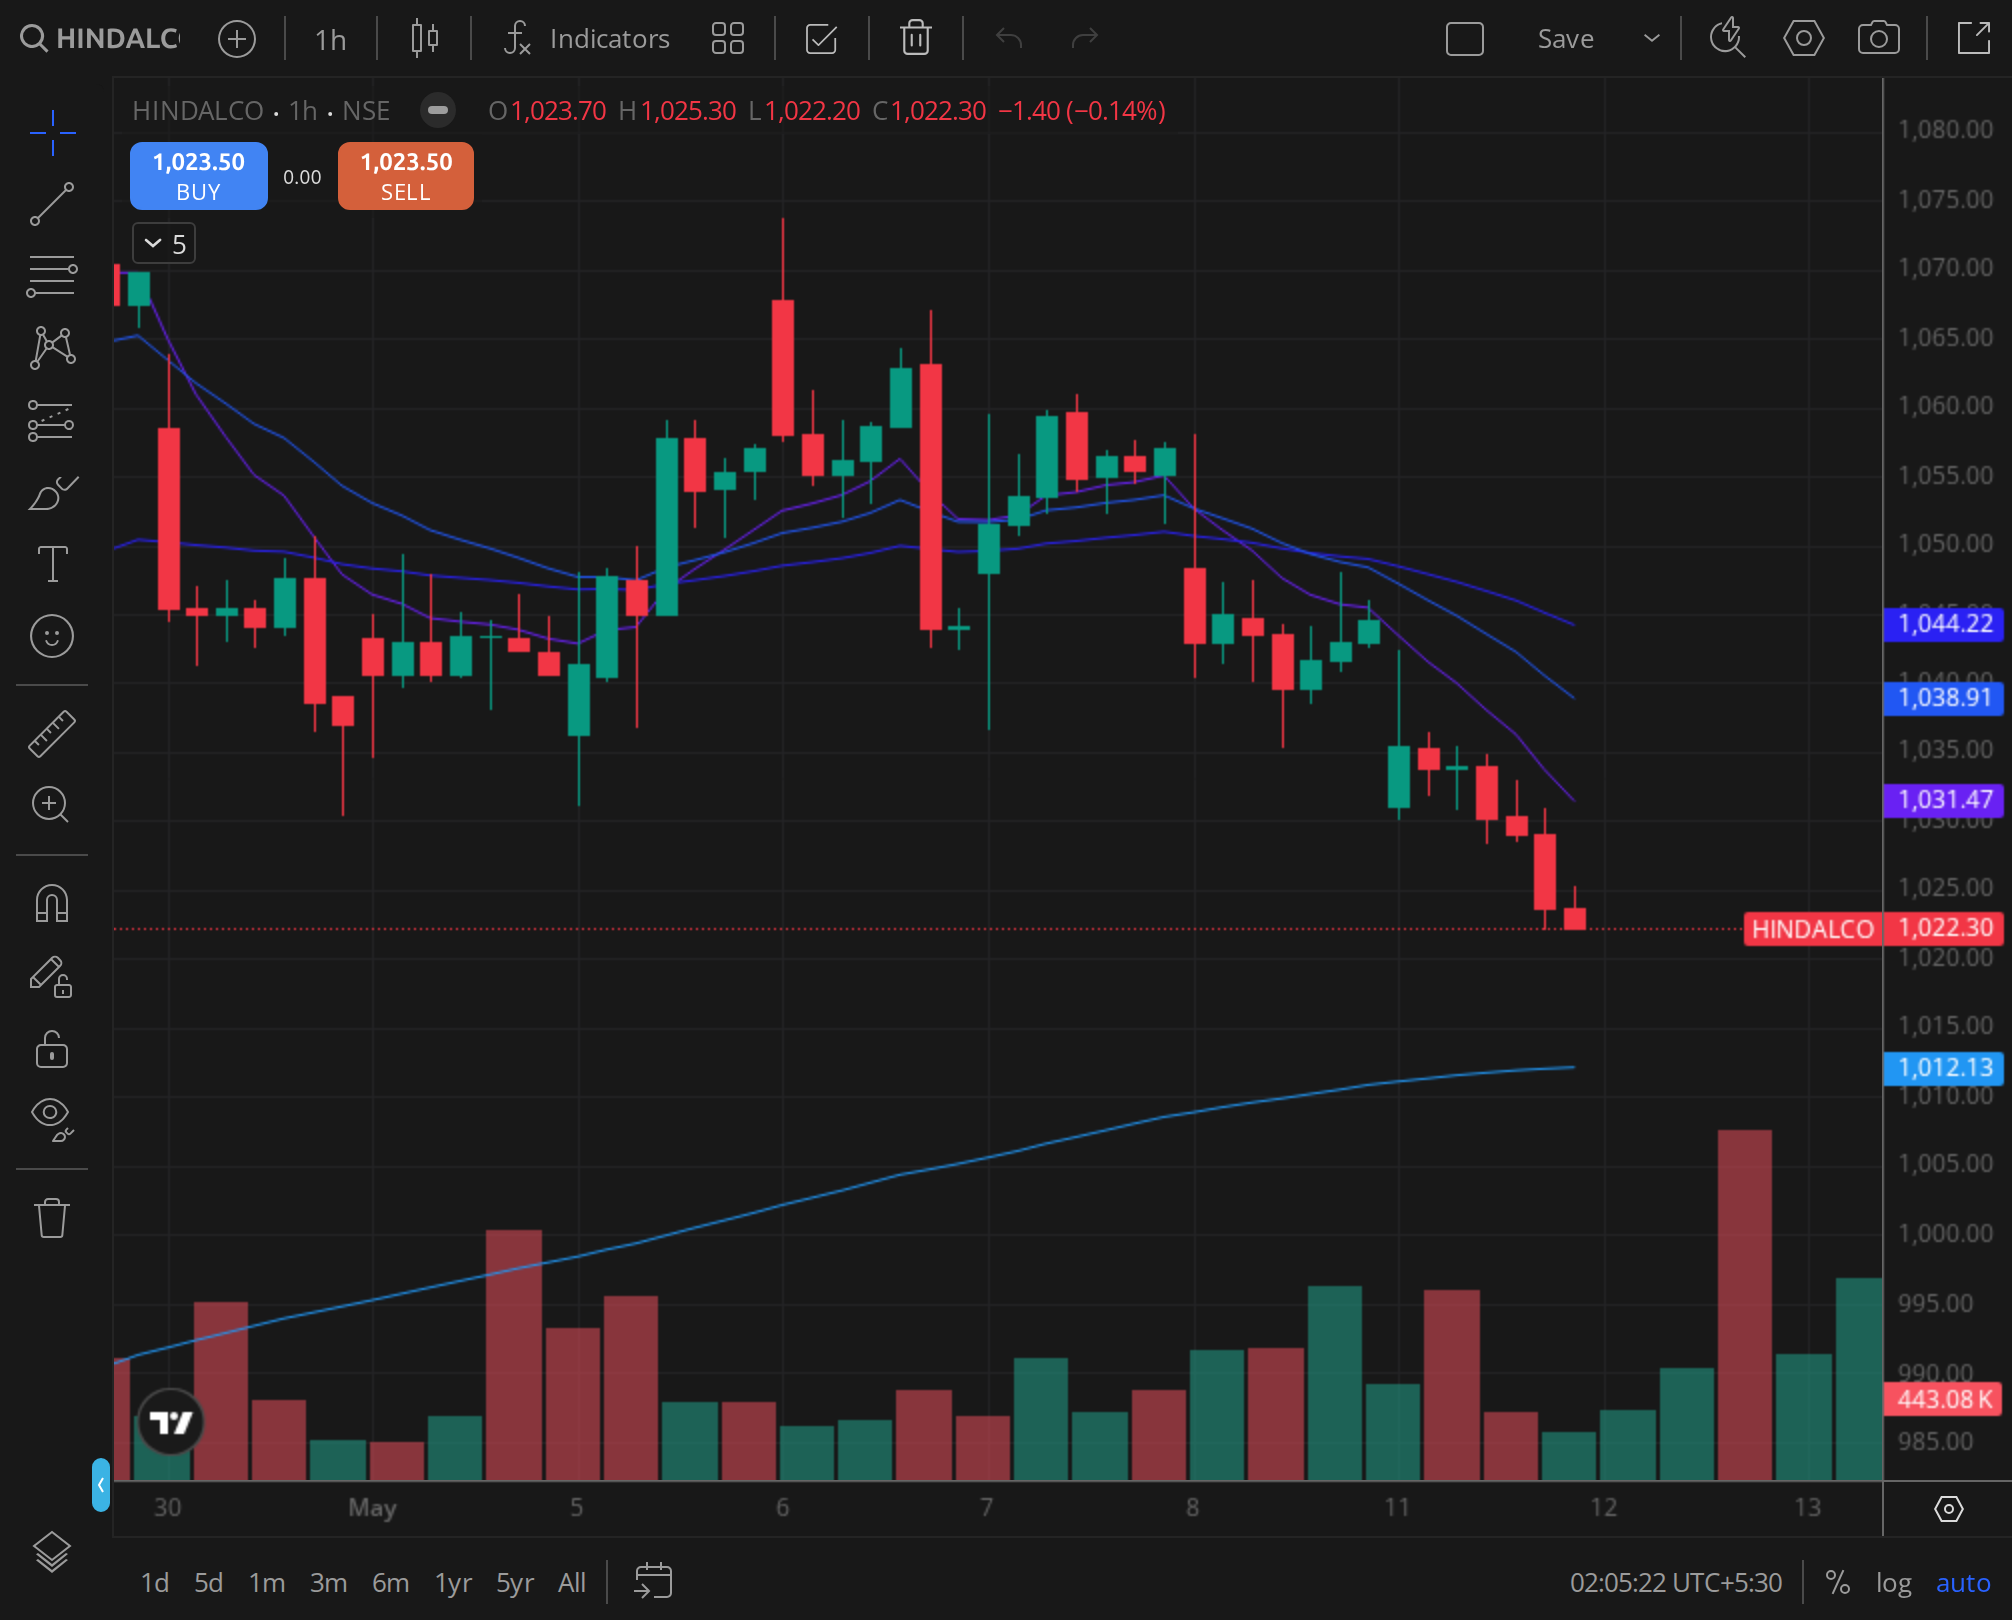
Reference chart28 Oct 2025
The daily frame the desk reads on HINDALCO.
FAQ17 reader questions · AEO-eligible
The line on HINDALCO, distilled and schema-marked for AI Overview, Perplexity, and reader search.
What is the HINDALCO share price target for 2026?
BazaarBaazi does not publish a SEBI-registered price target on HINDALCO. The desk reads structural support and resistance inside each show against the printed spot; the most recent editorial line is Systematic Read on 21 Jul 2026.
What is BazaarBaazi's Crack Score for HINDALCO?
The BazaarBaazi Crack Score for HINDALCO is 76 out of 100 as of 21 Jul 2026, a high conviction reading. It is a computed conviction number from the signed stance, how consistent the recent verdicts have been, the quality of the printed structure, and how fresh the review is. It is a transparency signal, not investment advice.
What is the F&O view on HINDALCO?
Strike-level option inventory for HINDALCO is unavailable, so BazaarBaazi withholds participant, direction and positioning claims. The editorial chart stance is not substituted for an option-chain observation.
What sector is HINDALCO in and which peers does BazaarBaazi track?
HINDALCO sits in Metals & Mining (large cap), indicative market cap ~2.1 lakh cr (indicative), ISIN INE038A01020. The peers BazaarBaazi reads alongside it are JSW STEEL LIMITED, GRAVITA INDIA LIMITED, Lloyds Metals and Energy Limited. A systematic, data-only read on HINDALCO INDUSTRIES LIMITED: where it trades versus its 50-day and 200-day lines, the live 52-week range, and momentum, refreshed from the scanner's real price series each run.
How often is the HINDALCO view updated?
This page is one evergreen URL refreshed in place. The Crack Score and levels re-compute on every BazaarBaazi end-of-day run, and the dated stamp shows the last refresh. The latest signed verdict on HINDALCO is mixed, published in Systematic Read on 21 Jul 2026.
Is Hindalco a good long-term stock?
What drives this name is Novelis's auto-sheet volume and per-tonne margin riding EV lightweighting on top of India's domestic demand, and the risk the Crack Score cannot fully capture is that the upstream smelters keep you hostage to the LME aluminium price and smelter power costs regardless of how well Novelis executes. The Crack Score on this page reflects that balance between price risk, Novelis earnings quality and India smelter cost.
What is the Hindalco share price target for 2030?
The 2030 case rests on Novelis's auto-sheet expansion and India's aluminium demand, but it still sits on top of an LME price no one can forecast four years out, so a fixed target would be false precision. The Crack Score gives the current structural read on those drivers instead.
Why is Hindalco share price falling?
The move is most often the LME aluminium price turning down or a soft Novelis margin print, with smelter power-cost worries or a metals-wide risk-off piling on. Check whether Novelis is the culprit or it is just the commodity tape, because the market pays a premium for the Novelis half.
Is HINDALCO a qualifying setup on the BazaarBaazi scanner right now?
On the 2026-07-31 run of the 500-name BazaarBaazi setup scanner, HINDALCO INDUSTRIES LIMITED sits in the Scanned tier with a setup score of 77/100 (technical 100, fundamental 67). The scanner is a deterministic engine over real OHLCV and official filings, refreshed nightly, and it is a signal rather than investment advice.
Where can I read HINDALCO INDUSTRIES LIMITED's earnings call transcripts?
BazaarBaazi indexes 17 HINDALCO earnings calls going back to 2021-12-31, latest 2026-05-31. Every entry on this page links straight to the transcript PDF the company filed with the exchange, so you read management in the primary source.
What was HINDALCO INDUSTRIES LIMITED's Q4 FY26 net profit?
HINDALCO INDUSTRIES LIMITED reported a net profit of Rs 2,597 cr for Q4 FY26 (the quarter ended 31 March 2026). That is -50.9% year on year. The figure is from the company's official NSE filing.
What was HINDALCO INDUSTRIES LIMITED's Q4 FY26 revenue?
HINDALCO INDUSTRIES LIMITED reported revenue of Rs 78,133 cr for Q4 FY26. That is +20.4% year on year. The figure is from the company's official NSE filing.
How does BazaarBaazi rate HINDALCO INDUSTRIES LIMITED's Q4 FY26 result?
BazaarBaazi gives HINDALCO INDUSTRIES LIMITED's Q4 FY26 result a Result Pulse of 52 out of 100, with a verdict of Mixed. The Result Pulse is a BazaarBaazi editorial score for the quality of the filed result, not investment advice.
What has Hindalco Industries Ltd announced recently?
Hindalco Industries Ltd's two most material recent disclosures are an earnings dated 29 Jul 2026, and a press release dated 27 Jul 2026, "Novelis Inc. a wholly owned subsidiary of the Company has…". Both link to the company's own official filing on the BazaarBaazi stock page.
Has Hindalco Industries Ltd declared a dividend recently?
Yes. Hindalco Industries Ltd filed a dividend disclosure on 10 Jul 2026, filed as "Dividend - Rs 5 Per Share". Any amount shown is the exchange's own record, linked from the BazaarBaazi stock page. A dividend is a declared payout, not a forecast of future returns.
What did Hindalco Industries Ltd's latest board meeting cover?
Hindalco Industries Ltd's most recent board-meeting disclosure on record dated 30 Jun 2026 reads "Notice of Annual General Meeting to be held on July 23, 2026". That is the agenda as filed with the exchange, linked from the BazaarBaazi stock page, and BazaarBaazi adds no claim of its own to it.
Has Hindalco Industries Ltd's credit rating been updated recently?
Hindalco Industries Ltd filed a credit-rating disclosure on 09 Apr 2026, recorded with the exchange as "ESG Rating". The detail sits in the linked filing on the BazaarBaazi stock page. A rating action is an agency view on debt, separate from the share price.
Related stock views
The names BazaarBaazi reads alongside HINDALCO, each a living view refreshed every end-of-day run.
Hub
All stock views
The full BazaarBaazi coverage universe, scored and dated.
Metals & Mining
JSWSTEEL
JSW STEEL LIMITED
Metals & Mining
GRAVITA
GRAVITA INDIA LIMITED
Metals & Mining
LLOYDSME
Lloyds Metals and Energy Limited
Metals & Mining
ADANIENT
Adani Enterprises Limited
Metals & Mining
GMDCLTD
GUJARAT MINERAL DEVELOPMENT CORPORATION LIMITED