Stock · CIPLA · Healthcare
CIPLA share price target 2026
Support, resistance, the F&O structure and the BazaarBaazi Crack Score for CIPLA LIMITED, refreshed every end-of-day run. A systematic, data-only read on CIPLA LIMITED: where it trades versus its 50-day and 200-day lines, the live 52-week range, and momentum, refreshed from the scanner's real price series each run.
The verdict
BazaarBaazi reads CIPLA as range-bound with a Crack Score of 53/100 as of 21 Jul 2026.
BazaarBaaziSource & method
The scanner's readScanned · scanned 31 Jul 2026
Where CIPLA stands on the 500-name BazaarBaazi setup scanner: technicals, filed fundamentals and money flow read together, refreshed every run.
Scanned and scored this run, but the evidence is incomplete or conflicted. The engine fails closed to NO_TRADE.
Technical axis
100/100Fundamental axis
33/100Money flow
52/100Result pulse · Q4 FY26
24/100Technical evidence
price above 50DMA
price above 150DMA
price above 200DMA
200DMA rising
golden cross 17 bars ago
price above 50DMA
ADX 22.0 (trend building)
RSI 61.5 (momentum up)
Red flags
above 200DMA (not a confirmed short-side trend)
profit collapse (-55.32% YoY)
weak filed result (score 24.0)
Relative valuation
P/E (TTM)
30.7P/E vs sector
+0.6%Sector percentile
19PEG
n/aScanner levels from the deterministic engine run of 2026-07-31, not a SEBI-registered recommendation and not investment advice. The fundamental axis reads the official filing: Q4 FY26 result.
Price target: support and resistanceComputed 21 Jul 2026
Support and resistance for CIPLA are read inside the latest show; no spot was printed in the most recent editorial note.
Levels are read inside the latest show. The most recent editorial reference is Systematic Read on 21 Jul 2026.
These are structural reference lines, not a SEBI-registered price target. BazaarBaazi is independent media; the levels frame how the desk reads the CIPLA chart, refreshed every end-of-day run.
The Crack Score, and how it is built53 / 100 · Range / mixed
The Crack Score is a deterministic 0 to 100 conviction number. Here is exactly what moved it for CIPLA, so the figure is a transparent signal rather than a vibe.
Base 50, adjusted by the factors above and clamped to 0 to 100. How the Crack Score works.
About CIPLA LIMITEDBusiness profile
What CIPLA actually does, and the edge that holds its position.
Cipla's edge is breathing, literally, its decades in respiratory and inhalers is the hard-to-copy moat that separates it from plain-vanilla generics. It is one of India's largest drugmakers, strong in domestic branded generics and a US business built around complex and specialty molecules, with asthma and COPD inhaler formulations as a core competency. It also runs a growing South Africa and sub-Saharan Africa branded business and a North America biosimilars pipeline, but the inhaler franchise is where its differentiation truly sits.
Cipla's edge is its deep respiratory drug expertise and inhaler manufacturing capability, where complex device-drug combination products are harder for generics competitors to replicate than simple oral solid dosage forms. Its India brand strength in chronic therapy categories like respiratory, cardiology and HIV creates stickier revenue than the typical generics business.
The F&O viewHorizon · swing
How the futures and options structure on CIPLA reads right now.
The editorial price read on CIPLA is neutral. Strike-level option inventory is unavailable, so the page withholds writer, wall and pin claims. Single-stock F&O on CIPLA can be thinner than index F&O, so the desk weights price and filed evidence over raw OI. This is not a derivatives trade recommendation.
Why it movedLatest editorial line
The most recent BazaarBaazi read on what is driving CIPLA.
Systematic read: a disclosed, data-only model on real 1-year price structure.
Read in Systematic Read on 21 Jul 2026. Why CIPLA moved, the living explainer, tracks every move on one URL.
The 2026 to 2030 pictureStructural read
What genuinely drives CIPLA over a multi-year horizon. A structural read, not a price forecast.
From 2026 to 2030, the key drivers for Cipla are the US complex-inhaler pipeline (including gAdvair and other branded references) gaining approvals, the biosimilars opportunity through its North America pipeline, and sustained India branded-generic growth in chronic therapy. The key risk is a USFDA inspection action at any key facility or further delays in complex-inhaler approvals from the US regulator. What BazaarBaazi thinks: the respiratory expertise is a real, durable edge and the chronic-therapy India book is sticky, but the timing risk no score can pin down is the US regulator, the complex-inhaler approvals that the bull case rests on can slip quarter after quarter for reasons entirely outside Cipla's control.
What to watch:
- US complex inhaler approvals and launch ramp, especially gAdvair
- USFDA facility inspection outcomes across manufacturing sites
- India branded-generic revenue growth and chronic therapy market-share
- South Africa business performance as a geography-diversification gauge
- Biosimilar pipeline progress and any licensing or partnership deal flow
Peers and how to compare5 listed names
The listed names CIPLA is most often read against. Compare them on the same Crack Score and levels.
Sun Pharmaceutical Industries · SUNPHARMA
Read the SUNPHARMA verdict and levels
Dr Reddys Laboratories · DRREDDY
Read the DRREDDY verdict and levels
Divis Laboratories · DIVISLAB
Read the DIVISLAB verdict and levels
Lupin
Listed peer in the same space
Aurobindo Pharma
Listed peer in the same space
Stored valuation readStored 2026-10-19
P/E, P/B, yield and the quality set for CIPLA LIMITED, computed only from the stored fundamentals snapshot dated 2026-10-19. No carried market price is presented as current.
P / E
31.8x
Earnings yield
3.15%
P / B
3.11x
P / S
3.81x
EV / EBITDA
18.8x
Dividend yield
0.98%
Market cap
Rs 1.07 lakh cr
Enterprise value
Rs 97,560 cr
Stored from CIPLA LIMITED's filed results, as of 2026-10-19 and currency-checked. Price input Rs 1,324.10 from baked EOD spot. Open the calculator, move the price and watch every ratio react.
Latest filed resultsQ4 FY26
CIPLA LIMITED's most recent quarter, parsed straight from the official NSE filing. Every figure links back to its primary source.
Result Pulse
24 / 100Revenue
Rs 6,541 crNet profit
Rs 543 crEPS (quarter)
Rs 6.87| Growth | YoY | QoQ |
|---|---|---|
| Revenue | -2.8% | -7.5% |
| Net profit | -55.3% | -19.5% |
| Net margin | +8.3% | |
Figures are the Q4 FY26 result for CIPLA LIMITED, parsed straight from the official NSE integrated filing and verified to the paisa. The EPS shown is for the quarter, not a trailing-twelve-month figure, so it is not a P/E input.
Earnings history, every filed quarter32 quarters on record
CIPLA LIMITED's official quarterly revenue, EPS and Result Pulse trail, every quarter the desk holds from the verified filings export, back to 30 Jun 2018. These are quarterly facts, not TTM valuation inputs.
CIPLA official result trail
32 quarters
Quarterly figures only: revenue, net profit and EPS are copied from official filings. EPS here is not trailing twelve month EPS and is not used for valuation.
| Quarter | Revenue | EPS | PAT YoY | Pulse | Source |
|---|---|---|---|---|---|
| Q4 FY26ended 31 Mar 2026 / Consolidated, audited | Rs 6,541 cr | Rs 6.87 | n/a | n/a | Filing |
| Q3 FY26ended 31 Dec 2025 / Consolidated, audited | Rs 7,074 cr | Rs 8.37 | n/a | 40/100 | Filing |
| Q2 FY26ended 30 Sep 2025 / Consolidated, audited | Rs 7,589 cr | Rs 16.73 | n/a | n/a | Filing |
| Q1 FY26ended 30 Jun 2025 / Consolidated, audited | Rs 6,957 cr | Rs 16.07 | n/a | 58/100 | Filing |
| Q4 FY25ended 31 Mar 2025 / Consolidated, audited | Rs 6,730 cr | Rs 15.13 | n/a | 58/100 | Filing |
| Q3 FY25ended 31 Dec 2024 / Consolidated, audited | Rs 7,073 cr | Rs 19.45 | n/a | n/a | Filing |
| Q2 FY25ended 30 Sep 2024 / Consolidated, audited | Rs 7,051 cr | Rs 16.13 | n/a | n/a | Filing |
| Q1 FY25ended 30 Jun 2024 / Consolidated, audited | Rs 6,694 cr | Rs 14.58 | n/a | n/a | Filing |
| Q4 FY24ended 31 Mar 2024 / Consolidated, audited | Rs 6,163 cr | Rs 11.63 | n/a | n/a | Filing |
| Q3 FY24ended 31 Dec 2023 / Consolidated, audited | Rs 6,604 cr | Rs 13.08 | n/a | n/a | Filing |
| Q2 FY24ended 30 Sep 2023 / Consolidated, audited | Rs 6,678 cr | Rs 14.01 | n/a | n/a | Filing |
| Q1 FY24ended 30 Jun 2023 / Consolidated, audited | Rs 6,329 cr | Rs 12.34 | n/a | n/a | Filing |
| Q4 FY23ended 31 Mar 2023 / Consolidated, audited | Rs 5,739 cr | Rs 6.51 | n/a | n/a | Filing |
| Q3 FY23ended 31 Dec 2022 / Consolidated, audited | Rs 5,810 cr | Rs 9.92 | n/a | n/a | Filing |
| Q2 FY23ended 30 Sep 2022 / Consolidated, audited | Rs 5,829 cr | Rs 9.78 | n/a | n/a | Filing |
| Q1 FY23ended 30 Jun 2022 / Consolidated, audited | Rs 5,375 cr | Rs 8.51 | n/a | n/a | Filing |
| Q4 FY22ended 31 Mar 2022 / Consolidated, audited | Rs 5,260 cr | Rs 4.49 | n/a | n/a | Filing |
| Q3 FY22ended 31 Dec 2021 / Consolidated, audited | Rs 5,479 cr | Rs 9.03 | n/a | n/a | Filing |
| Q2 FY22ended 30 Sep 2021 / Consolidated, audited | Rs 5,520 cr | Rs 8.82 | n/a | n/a | Filing |
| Q1 FY22ended 30 Jun 2021 / Consolidated, audited | Rs 5,504 cr | Rs 8.86 | n/a | n/a | Filing |
| Q4 FY21ended 31 Mar 2021 / Consolidated, audited | Rs 4,606 cr | Rs 5.13 | n/a | n/a | Filing |
| Q3 FY21ended 31 Dec 2020 / Consolidated, audited | Rs 5,169 cr | Rs 9.28 | n/a | n/a | Filing |
| Q2 FY21ended 30 Sep 2020 / Consolidated, audited | Rs 5,038 cr | Rs 8.25 | n/a | n/a | Filing |
| Q1 FY21ended 30 Jun 2020 / Consolidated, audited | Rs 4,346 cr | Rs 7.17 | n/a | n/a | Filing |
| Q4 FY20ended 31 Mar 2020 / Consolidated, audited | Rs 4,376 cr | Rs 3.05 | n/a | n/a | Filing |
| Q3 FY20ended 31 Dec 2019 / Consolidated, audited | Rs 4,371 cr | Rs 4.35 | n/a | n/a | Filing |
| Q2 FY20ended 30 Sep 2019 / Consolidated, audited | Rs 4,396 cr | Rs 5.85 | n/a | n/a | Filing |
| Q1 FY20ended 30 Jun 2019 / Consolidated, audited | Rs 3,989 cr | Rs 5.93 | n/a | n/a | Filing |
| Q4 FY19ended 31 Mar 2019 / Consolidated, audited | Rs 4,404 cr | Rs 4.56 | n/a | n/a | Filing |
| Q3 FY19ended 31 Dec 2018 / Consolidated, audited | Rs 4,008 cr | Rs 4.12 | n/a | n/a | Filing |
| Q2 FY19ended 30 Sep 2018 / Consolidated, audited | Rs 4,012 cr | Rs 4.68 | n/a | n/a | Filing |
| Q1 FY19ended 30 Jun 2018 / Consolidated, audited | Rs 3,939 cr | Rs 5.60 | n/a | n/a | Filing |
The official financialsFiled to 31 Mar 2026
CIPLA LIMITED's statements as filed: trailing twelve month P&L, the balance sheet, and the cash engine. Parsed from official XBRL, shown in crore.
Trailing twelve months, on filed quarters
Revenue (TTM)
28,163 crNet profit (TTM)
3,862 crEBIT (TTM)
5,278 crProfit before tax (TTM)
5,224 crNet margin (TTM)
13.7%Finance costs (TTM)
54.4 crBalance sheet, as filed 2026-03-31
Total assets
42,496 crShareholder equity
34,520 crTotal borrowings
258 crCash and equivalents
1,018 crInventory
6,597 crTrade receivables
5,620 crThe cash engine, latest filed year
Operating cash flow
3,940 crCapex
3,079 crFree cash flow
861 crInvesting flow
-2,326 crFinancing flow
-1,234 crAnnual trail, filed year over filed year
| Year | Revenue | Net profit | Equity | Borrowings | CFO |
|---|---|---|---|---|---|
| FY26 | 28,163 cr | 3,862 cr | 34,520 cr | 258 cr | 3,940 cr |
| FY25 | 27,548 cr | 5,269 cr | 31,289 cr | 92.1 cr | 5,005 cr |
| FY24 | 25,774 cr | 4,154 cr | 26,802 cr | 247 cr | 4,134 cr |
| FY23 | 22,753 cr | 2,833 cr | 23,714 cr | 520 cr | 3,238 cr |
| FY22 | 21,763 cr | 2,547 cr | 21,117 cr | 824 cr | 3,326 cr |
| FY21 | 19,160 cr | 2,389 cr | 18,586 cr | 1,537 cr | n/a |
Every figure is parsed from CIPLA LIMITED's official NSE XBRL filings by the BazaarBaazi earnings lab and shown in crore rupees. Display data, not a valuation model input.
Management on record34 earnings calls
Every CIPLA earnings call BazaarBaazi has indexed, latest 31 May 2026. Read management in its own words, straight from the filed transcript.
CIPLA LIMITED earnings calls on record
34 calls since 31 May 2020
Show 26 older calls
Each entry links to the transcript PDF the company filed with the exchange. Primary sources, in management's own words.
What changed76 disclosures
Every recent official filing from CIPLA LIMITED, straight from the exchange feed, with the BazaarBaazi Event Heat on the disclosure flow.
CIPLA LIMITED has filed 76 official disclosures recently. The most recent is a Disclosure dated 31 Jul 2026.
allotment of 7850 securities pursuant to ESOP/ESPS at its meeting held on July 31, 2026
Copy of Newspaper Publication of the unaudited financial results for the quarter ended 30th June, 2026
Cipla Limited has submitted to the Exchange, the financial results for the period ended June 30, 2026.
Cipla Limited has informed the Exchange that the Board has approved the changes in the Key Managerial Personnels (KMPs) and Officers authorised under Regulation 30(5) of the SEBI Listing Regulations.
Board Meeting to be held on 23-Jul-2026 to inter-alia consider and approve the Unaudited Financial results of the Company for the Quarterly ended June 2026
To consider and approve the unaudited standalone and consolidated financial results of the Company for the quarter ended 30th June, 2026.In terms of the Company's Code of Conduct for prevention of Insider Trading, the 'Trading window' for dealing in the securities of the Company will be closed from Wednesday, 1st July, 2026 till Saturday, 25th July, 2026 (both days inclusive) for the purpose of financial results.
Event Heat is withheld because the reproducible what-changed window is unavailable. Every line above links to its official exchange filing, and the full market desk is at the disclosures hub.
Key fundamentalsEditorial reference
The anchor data BazaarBaazi references when reading the CIPLA chart. Not a substitute for a registered research note.
| Ticker | CIPLA |
|---|---|
| Full name | CIPLA LIMITED |
| Sector | Healthcare |
| Index class | LARGE CAP |
| ISIN | INE059A01026 |
| Market-cap band | ~1.1 lakh cr (indicative) |
| Last referenced level | Inside latest show |
| Last session move | Not referenced this cycle |
| Editorial line in | Systematic Read on 21 Jul 2026 |
| Aliases tracked | CIPLA |
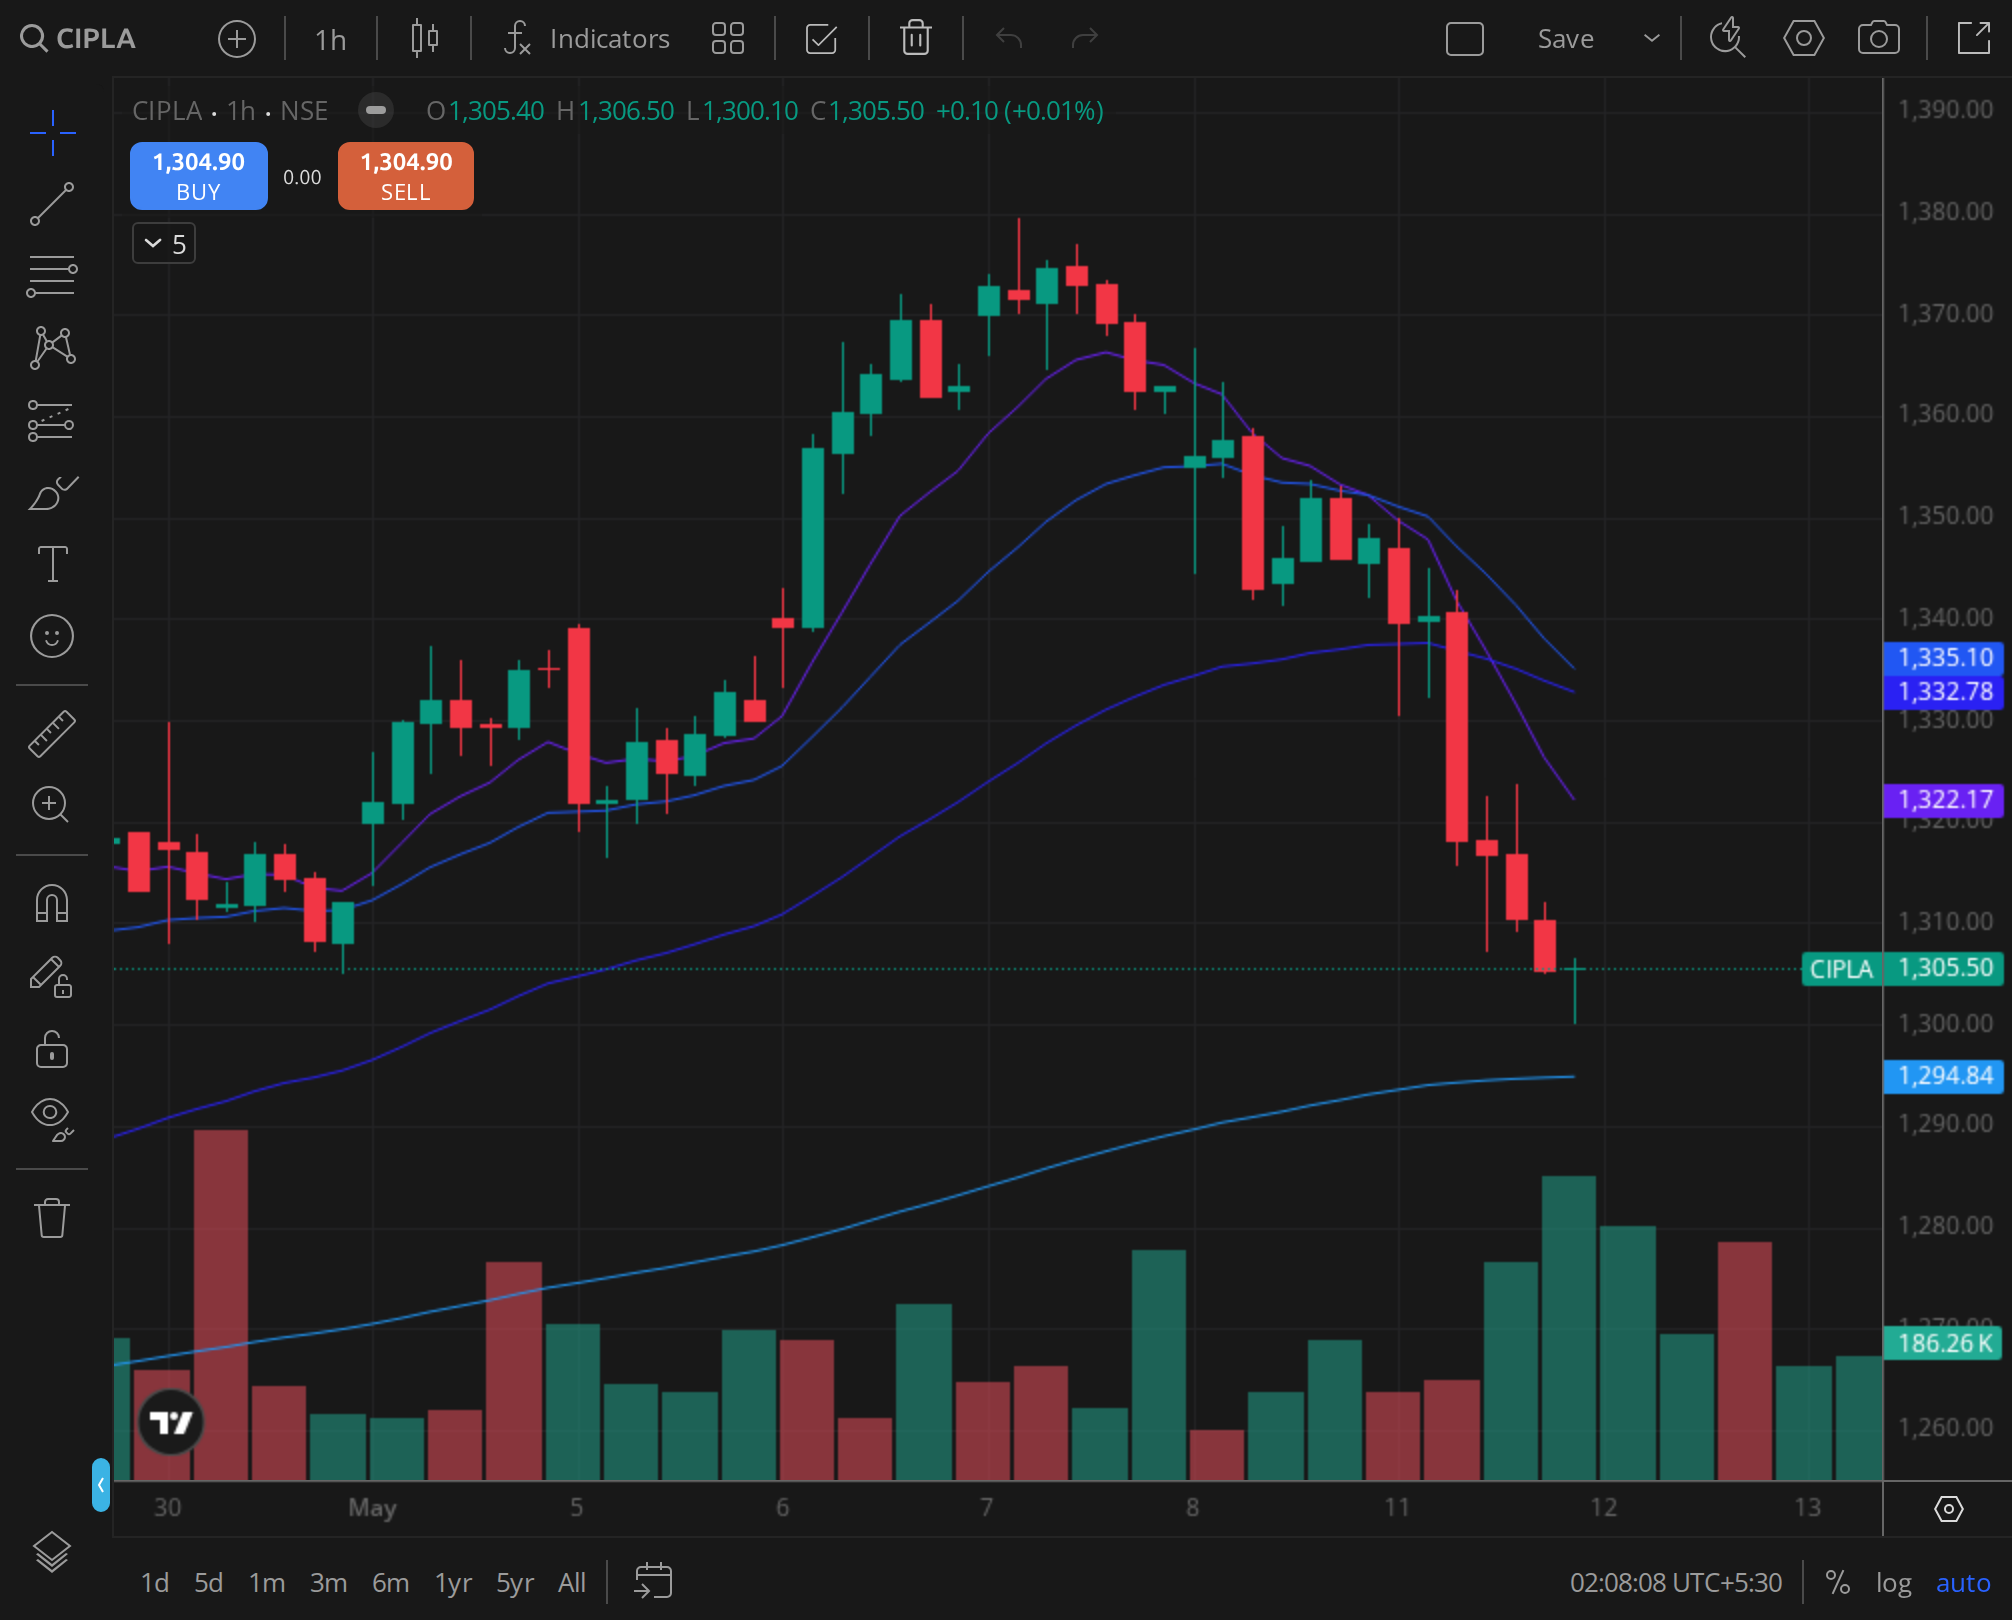
Reference chart2 Jan 2026
The daily frame the desk reads on CIPLA.
FAQ17 reader questions · AEO-eligible
The line on CIPLA, distilled and schema-marked for AI Overview, Perplexity, and reader search.
What is the CIPLA share price target for 2026?
BazaarBaazi does not publish a SEBI-registered price target on CIPLA. The desk reads structural support and resistance inside each show against the printed spot; the most recent editorial line is Systematic Read on 21 Jul 2026.
What is BazaarBaazi's Crack Score for CIPLA?
The BazaarBaazi Crack Score for CIPLA is 53 out of 100 as of 21 Jul 2026, a range / mixed reading. It is a computed conviction number from the signed stance, how consistent the recent verdicts have been, the quality of the printed structure, and how fresh the review is. It is a transparency signal, not investment advice.
What is the F&O view on CIPLA?
Strike-level option inventory for CIPLA is unavailable, so BazaarBaazi withholds participant, direction and positioning claims. The editorial chart stance is not substituted for an option-chain observation.
What sector is CIPLA in and which peers does BazaarBaazi track?
CIPLA sits in Healthcare (large cap), indicative market cap ~1.1 lakh cr (indicative), ISIN INE059A01026. The peers BazaarBaazi reads alongside it are GLAND PHARMA LIMITED, Eris Lifesciences Limited, ACUTAAS CHEMICALS LIMITED. A systematic, data-only read on CIPLA LIMITED: where it trades versus its 50-day and 200-day lines, the live 52-week range, and momentum, refreshed from the scanner's real price series each run.
How often is the CIPLA view updated?
This page is one evergreen URL refreshed in place. The Crack Score and levels re-compute on every BazaarBaazi end-of-day run, and the dated stamp shows the last refresh. The latest signed verdict on CIPLA is neutral, published in Systematic Read on 21 Jul 2026.
Is Cipla a good long-term stock?
The structural case is built on complex-inhaler expertise and a chronic-therapy India franchise harder to displace than commodity generics, but the risk no score captures is that the key US inhaler approvals can stall on the regulator's timeline, not Cipla's. BazaarBaazi's Crack Score for CIPLA captures the current setup. The long-term view depends on US complex inhaler approval velocity and regulatory risk management.
Cipla share price target 2030?
What drives CIPLA through 2030 is gAdvair and complex-inhaler approvals scaling in the US, India branded compounding, and biosimilars adding a layer, with the catch that approval timing is set by the USFDA and no target can fix the calendar. BazaarBaazi does not publish fixed multi-year targets. The dated Crack Score is the right entry point.
Why is Cipla share falling?
Weakness in CIPLA usually starts with the triggers the desk watches first, a USFDA observation on a key facility or US inhaler approval delays, with an India volume miss or South Africa slowdown adding to it. The Crack Score levels have the technical picture.
Is CIPLA a qualifying setup on the BazaarBaazi scanner right now?
On the 2026-07-31 run of the 500-name BazaarBaazi setup scanner, CIPLA LIMITED sits in the Scanned tier with a setup score of 67/100 (technical 100, fundamental 33). The scanner is a deterministic engine over real OHLCV and official filings, refreshed nightly, and it is a signal rather than investment advice.
Where can I read CIPLA LIMITED's earnings call transcripts?
BazaarBaazi indexes 34 CIPLA earnings calls going back to 2020-05-31, latest 2026-05-31. Every entry on this page links straight to the transcript PDF the company filed with the exchange, so you read management in the primary source.
What was CIPLA LIMITED's Q4 FY26 net profit?
CIPLA LIMITED reported a net profit of Rs 543 cr for Q4 FY26 (the quarter ended 31 March 2026). That is -55.3% year on year. The figure is from the company's official NSE filing.
What was CIPLA LIMITED's Q4 FY26 revenue?
CIPLA LIMITED reported revenue of Rs 6,541 cr for Q4 FY26. That is -2.8% year on year. The figure is from the company's official NSE filing.
How does BazaarBaazi rate CIPLA LIMITED's Q4 FY26 result?
BazaarBaazi gives CIPLA LIMITED's Q4 FY26 result a Result Pulse of 24 out of 100, with a verdict of Weak. The Result Pulse is a BazaarBaazi editorial score for the quality of the filed result, not investment advice.
What has Cipla Ltd announced recently?
Cipla Ltd's two most material recent disclosures are a disclosure dated 31 Jul 2026, "allotment of 7850 securities pursuant to ESOP/ESPS at its…", and an investor meet dated 27 Jul 2026, "Transcript". Both link to the company's own official filing on the BazaarBaazi stock page.
Has Cipla Ltd declared a dividend recently?
Yes. Cipla Ltd filed a dividend disclosure on 08 Jun 2026, filed as "communication on tax deduction at source on final dividend for FY…". Any amount shown is the exchange's own record, linked from the BazaarBaazi stock page. A dividend is a declared payout, not a forecast of future returns.
What did Cipla Ltd's latest board meeting cover?
Cipla Ltd's most recent board-meeting disclosure on record dated 23 Jul 2026 reads "Board Meeting to be held on 23-Jul-2026 to inter-alia consider and…". That is the agenda as filed with the exchange, linked from the BazaarBaazi stock page, and BazaarBaazi adds no claim of its own to it.
Has Cipla Ltd's credit rating been updated recently?
Cipla Ltd filed a credit-rating disclosure on 12 Jul 2026, recorded with the exchange as "ESG Rating". The detail sits in the linked filing on the BazaarBaazi stock page. A rating action is an agency view on debt, separate from the share price.
Related stock views
The names BazaarBaazi reads alongside CIPLA, each a living view refreshed every end-of-day run.