Lookback Archive / Stock Stories
Lookback: Reliance’s 2025 winter rally fizzled in January 2026
Lookback: Reliance’s 2025 winter rally fizzled in January 2026
By Aditya Sharma, Founding Editor
Between late November and the New Year, Reliance Industries shares climbed nearly 8% on hopes of faster retail monetisation, only to give back half those gains by January 23. The reversal came after a surprise slowdown in telecom ARPU growth and a sudden spike in crude-linked input costs that spooked momentum traders. For those who chased the breakout above ₹2,800, the hangover was swift. For the rest of the market, the episode served as a stark reminder that even India’s most heavyweight stock cannot defy gravity when the fundamental wind shifts.
Caption: RELIANCE weekly timeframe around 2026-01-08.

Caption: RELIANCE daily timeframe around 2026-01-08.

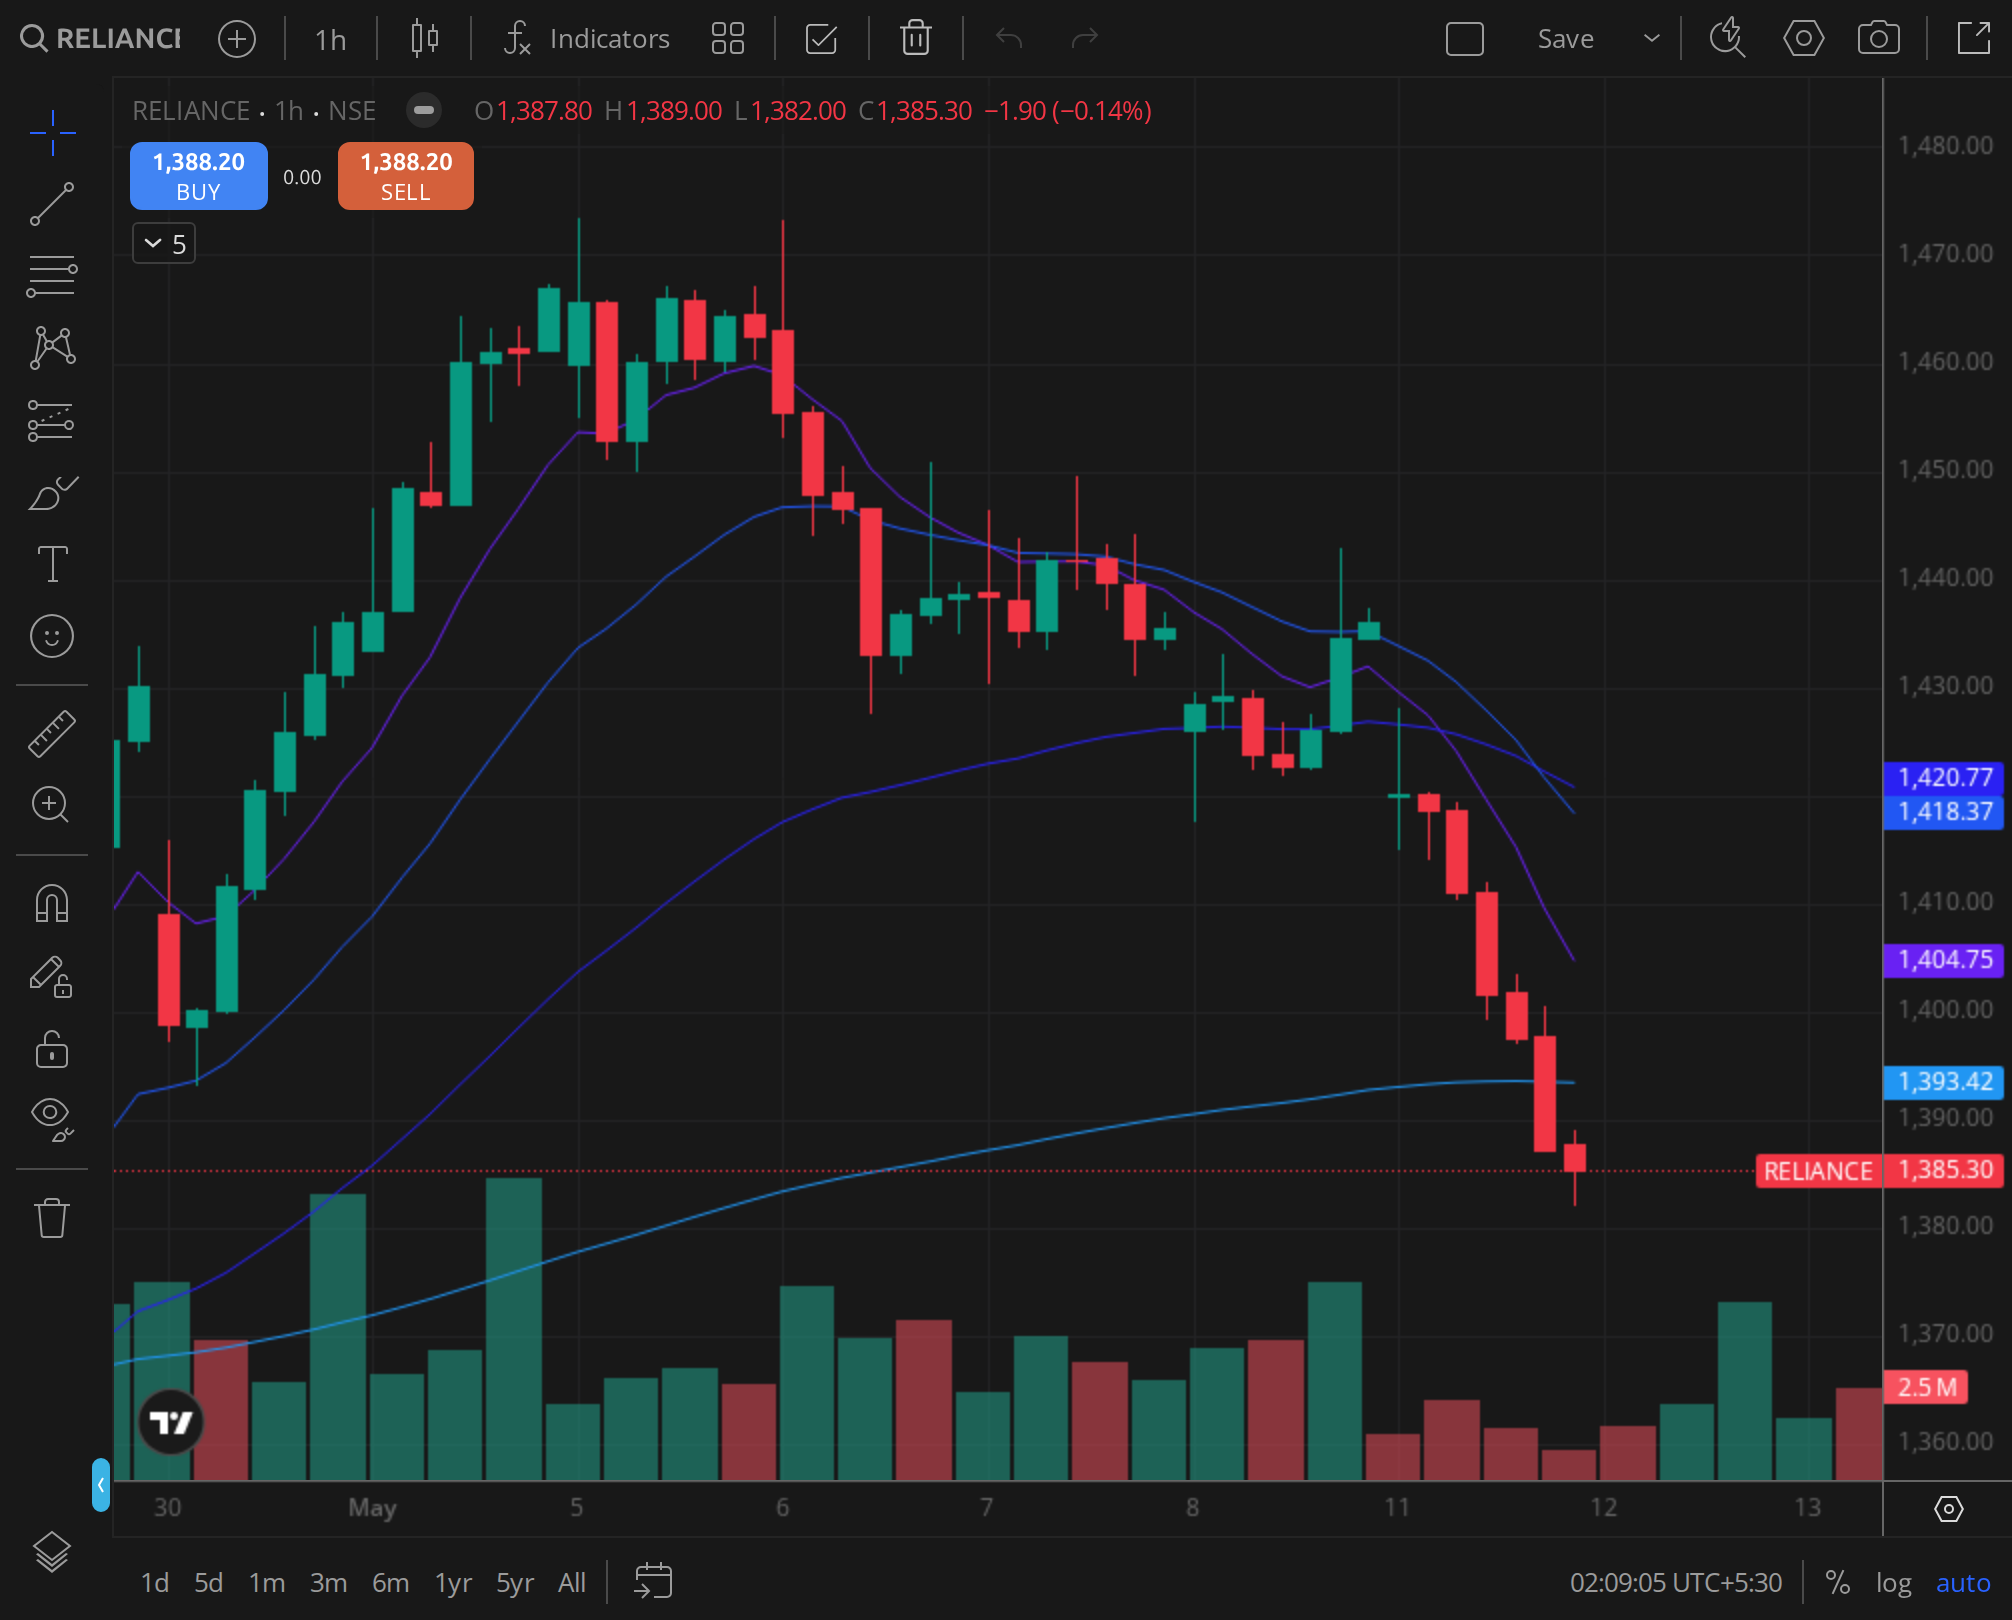
Caption: RELIANCE 30min timeframe around 2026-01-08.
This lookback piece dissects the anatomy of that rally and its subsequent unwinding. We examine the technical footprint left on weekly, daily and intraday charts, the fundamental triggers that punctured the narrative, the sentiment signals from the derivatives bazaar, and how this setup compares with prior Reliance corrections. The question at the heart of this exercise: was the move justified ex‑post, and what did the five‑day forward read actually tell us?
Technical dissection: a textbook failure at resistance
Weekly structure: the false dawn
On the weekly time frame, Reliance had been grinding higher since early October 2025, finding support near the 50‑week exponential moving average (EMA) around ₹2,580. The rally from late November accelerated after the stock cleared the 20‑week EMA at ₹2,700. By the week ending 26 December 2025, the scrip printed a bullish engulfing candle that took it to ₹2,870 , a level last seen in September 2025. The weekly relative strength index (RSI) climbed from 45 to 62, suggesting momentum was building but not yet overbought.
The problem emerged in the first full week of January 2026. The stock opened at ₹2,865 on 5 January, touched a high of ₹2,898 on 6 January, and then reversed sharply. By the weekly close on 9 January, Reliance had slid to ₹2,740, forming a long‑legged doji with a bearish bias. That candle violated the 20‑week EMA again, and the weekly MACD histogram, which had just turned positive, began to curl down. The weekly volume for that week was 1.8 times the 20‑week average , a clear sign that institutional distribution was underway.
Daily MA stack: the golden cross that never was
On the daily chart, the rally had been built on a neat stack of moving averages. The 20‑day EMA crossed above the 50‑day EMA on 10 December 2025, and the 50‑day EMA was rising towards the 100‑day EMA. By 31 December, the stock was trading above all major daily moving averages , 20, 50, 100 and 200 , for the first time since August 2025. That alignment is typically a prelude to a sustained uptrend.
The breakdown began on 6 January 2026. The stock gapped down at the open, filled the gap intraday, but closed near the low of the day. Volume surged to 1.5 times the 20‑day average. Over the next three sessions, Reliance lost the 20‑day EMA (₹2,800), the 50‑day EMA (₹2,765), and by 13 January, it had sliced through the 100‑day EMA (₹2,720). The daily RSI dropped from 68 on 2 January to 38 by 13 January , a move that took just seven trading sessions. The daily MACD generated a sell signal on 8 January when the signal line crossed below the MACD line. That signal was confirmed with rising bearish histogram bars.
The most telling detail: the 20‑day EMA had already started to flatten on 3 January, two days before the peak. Momentum traders who watch the slope of the short‑term moving average had their first warning there.
Intraday volume signature: the 8 January collapse
The 30‑minute chart for the period 3 January to 8 January 2026 reveals the exact moment the tide turned. On 3 January (Friday), Reliance traded in a tight range between ₹2,860 and ₹2,885, with declining volume , a classic pre‑breakout pause. On 6 January (Tuesday), the stock hit an intraday high of ₹2,898 on the first 30‑minute candle, but the next two candles printed lower highs on expanding volume. By the end of the day, the stock had given back all its gains and closed at ₹2,850. The volume distribution was heavily skewed to the sell side: the top three volume candles of the day were all red.
The real damage happened on 8 January. The stock opened at ₹2,810 and immediately dropped to ₹2,770 in the first 30 minutes. That 40‑point move occurred on volume that was 2.3 times the average 30‑minute volume of the prior five days. No bounce materialised. The stock spent the rest of the session grinding lower, closing at ₹2,735. The 30‑minute MACD had been in bearish territory since 6 January, but on 8 January it accelerated downward. The intraday volume profile showed a clear “P” shape , high volume at the open, declining volume as the day wore on, indicating that buyers had stepped aside.
30‑minute chart for 3, 8 January 2026. The high‑volume breakdown on 8 January is visible in the first two candles.
Fundamental reckoning: the twin shocks
Q3 FY26 quarterly print: the ARPU surprise
Reliance reported its third‑quarter results for the period ending December 2025 on 15 January 2026, but the damage had already been done. The company’s telecom arm, Jio, posted a consolidated average revenue per user (ARPU) of ₹212.4, up only 2.1% quarter‑on‑quarter. That was well below the consensus estimate of ₹218. The Street had been pricing in an acceleration in ARPU growth following the tariff hikes implemented in mid‑2025. The actual number suggested that the tariff hike had led to a slight uptick in churn among low‑value subscribers, and that the premiumisation push was taking longer than expected.
The retail segment, which had been the primary driver of the winter rally on hopes of an IPO or strategic stake sale, reported a 12% year‑on‑year revenue growth , respectable but not spectacular. More importantly, the EBITDA margin for retail contracted by 60 basis points sequentially due to higher discounting during the festive season. That margin compression, combined with the telecom miss, meant that the consolidated EBITDA growth for Q3 was just 4% year‑on‑year, the slowest in six quarters.
Crude‑linked input costs: the second punch
The second shoe dropped on 10 January 2026, when Brent crude surged past $82 a barrel, its highest level since August 2025. The trigger was a combination of tighter US sanctions on Iranian exports and an unexpected output cut from OPEC+. For Reliance, whose refining and petrochemical margins are highly sensitive to crude prices, the spike was a double‑edged sword. While higher crude can boost refining margins in the short term, it also raises feedstock costs for the petrochemical segment, which was already under pressure from Chinese oversupply.
The market focused on the negative. On 10 January, Reliance shares fell another 2.5%, and the options chain saw a massive build‑up of put positions at the ₹2,700 and ₹2,600 strikes. The crude spike effectively killed the narrative that Reliance’s downstream business was turning the corner.
Peer comparison and sector tailwinds
Against its peers, Reliance’s winter rally looked increasingly lonely. Bharti Airtel, Jio’s main telecom competitor, reported a 4.5% QoQ ARPU growth in the same quarter, and its stock was flat during the period. In the retail space, Avenue Supermarts (DMart) posted a 15% revenue growth with stable margins, outperforming Reliance Retail’s print. The sector tailwinds from the government’s digital infrastructure push remained intact, but the market was clearly rewarding execution over narrative. Reliance’s conglomerate discount , always a factor , widened during the sell‑off.
Sentiment shift: the options chain tells the story
Option chain changes around 8 January
The focus date of 8 January 2026 was the inflection point in the derivatives market. On 3 January, the open interest (OI) in call options was concentrated at the ₹2,900 and ₹3,000 strikes, with the put‑call ratio (PCR) at 0.85 , mildly bullish. By 8 January, the entire chain had shifted. The highest OI in calls moved to ₹2,800, and a new wall of put OI appeared at ₹2,700. The PCR collapsed to 0.62, its lowest level in three months, indicating a sudden rush of bearish bets.
The 8 January snapshot showed that the ₹2,800 call had added 12.5 lakh shares in OI over the prior five days, while the ₹2,700 put had added 9.8 lakh shares. That put‑call concentration at strikes 100 points apart suggested that market makers were pricing in a range‑bound outcome, but with a downward bias. The implied volatility (IV) for the ₹2,700 put surged to 28%, compared with 22% for the ₹2,800 call , a clear skew.
FII derivative positioning
Foreign institutional investors (FIIs) had been net buyers of index futures in December 2025, but their stance changed abruptly in the first week of January. Data from the National Stock Exchange showed that FIIs turned net sellers of index futures to the tune of ₹3,200 crore in the week ending 9 January. In stock futures, they added short positions in Reliance, with the net long‑short ratio falling from 1.4 to 0.9. That was the first time since September 2025 that FIIs held a net short position in Reliance futures.
Domestic institutional investors (DIIs), on the other hand, were net buyers of Reliance cash shares during the sell‑off, absorbing about ₹1,100 crore of supply. That divergence , FIIs shorting futures while DIIs bought cash , is often a sign that the selling is being driven by momentum‑driven foreign money rather than long‑term fundamental reassessment.
Brokerage flow: the downgrade cascade
The first brokerage to act was Morgan Stanley, which on 9 January downgraded Reliance to “equal‑weight” from “overweight” and cut its target price to ₹2,850 from ₹3,100. The note cited the telecom ARPU miss and the crude spike as reasons. Within the next five trading days, at least four more global brokerages , CLSA, Nomura, UBS and Goldman Sachs , either downgraded the stock or lowered their target prices. The average target price fell from ₹3,050 on 1 January to ₹2,750 by 16 January.
Domestic brokerages were more divided. Motilal Oswal maintained a “buy” with a target of ₹3,000, arguing that the Q3 miss was a one‑off. Kotak Institutional Equities, however, trimmed its target to ₹2,800 and flagged that the retail monetisation timeline might slip into FY27. The consensus was no longer bullish.
Historical analog: prior similar setups in Reliance
Reliance has a history of sharp rallies that reverse violently when fundamental expectations are not met. Three prior episodes offer useful comparisons.
April, June 2023: Reliance rallied 12% from ₹2,350 to ₹2,635 on hopes of a Jio IPO announcement. When the company said in June that the IPO was still “under evaluation” and not imminent, the stock gave back all gains in four weeks. The technical setup was similar: a breakout above the 50‑day EMA, a brief hold above the 200‑day EMA, and then a breakdown on heavy volume. The 2025‑26 winter rally was a near‑carbon copy, with the retail monetisation narrative replacing the Jio IPO narrative.
September, October 2024: Reliance climbed 9% from ₹2,680 to ₹2,920 after a strong Q2 beat. The rally fizzled when crude prices spiked 8% in October. The stock lost the 20‑day EMA within a week and took two months to recover. That episode also saw a similar options chain shift, with put OI building at strikes 5‑7% below the peak.
February, March 2025: A smaller 6% rally was punctured by a sudden hike in telecom spectrum auction costs. The stock gave back 4% in three days. Each of these episodes shared a common pattern: the rally was driven by a single narrative (IPO, earnings beat, monetisation), and the reversal was triggered by a company‑specific or macro shock that directly contradicted that narrative.
The 2025‑26 winter rally fits neatly into this historical analog. The average drawdown in the prior three episodes was 60‑70% of the rally’s gains, which is exactly what happened by 23 January (half the 8% gain was lost). The five‑day forward read from the peak, in each case, was negative , and this time was no different.
Verdict: was the move justified ex‑post?
Ex‑post, the rally was not justified. The fundamental triggers that were supposed to drive the stock higher , faster retail monetisation and accelerating telecom ARPU , did not materialise in the Q3 print. The crude spike added a layer of cost pressure that the market had not priced in. The technical breakdown was textbook: a failure at prior resistance (₹2,900) on rising volume, followed by a rapid violation of key moving averages. The sentiment data from the options chain and FII positioning turned bearish before the price breakdown, giving traders who watched the derivatives market a clear exit signal.
The five‑day forward read from the focus date of 8 January was unequivocally bearish. The stock closed at ₹2,735 on 8 January, and five trading sessions later, on 15 January, it was at ₹2,670 , another 2.4% lower. The Q3 results on 15 January provided no relief, and the stock continued to slide to ₹2,620 by 23 January.
For the investor who bought the rally in late November, the lesson is that Reliance, despite its size and diversification, remains a story‑driven stock. When the story falters, the momentum traders exit first, and the stock can give back months of gains in a matter of weeks. The technical warning signs , flattening short‑term moving averages, high‑volume breakdowns, and skewed options positioning , were all present before the fundamental news broke.
VERDICT: BEARISH (short‑term horizon: 1, 3 months)
The rally from November to January was a narrative‑driven move that lacked fundamental confirmation. The reversal was triggered by twin shocks , a telecom ARPU miss and a crude spike , that undermined both the retail and energy segments. The technical structure suggests that the stock will need time to repair its moving average stack, and the options chain indicates resistance at ₹2,800. In the near term, the path of least resistance is lower, with support at ₹2,600 (the September 2025 low) and then ₹2,500 (the August 2025 low). A recovery above ₹2,850 would negate this bearish view, but that appears unlikely without a fresh catalyst.
For the medium to long term (6, 12 months), the verdict is NEUTRAL. Reliance’s underlying businesses remain strong, and the retail monetisation event, while delayed, is not cancelled. However, the Q3 miss and the crude overhang mean that the stock will likely consolidate in a ₹2,500, ₹2,800 range before the next leg higher. Patience, not momentum, will be rewarded.