Lookback Archive / Stock Stories
Lookback: How RECLTD traded through a 60-day consolidation in early 2026
A 60-day grind in REC Limited that looked like indecision but was, a controlled distribution by institutions who had already booked their PSU re-rating.
For nine weeks between the close of 2025 and the last week of February 2026, RECLTD did almost nothing on the surface and everything underneath. The stock opened the window near the upper end of a band that, by the time February's monthly expiry came and went, looked less like accumulation and more like a slow exit. The brief tells the headline cleanly. From 29 December 2025 to 27 February 2026, REC Limited traded in a tight ₹460 to ₹495 corridor, failed each time it approached its 200-day moving average from below, and ended the window roughly 4% below the level at which it had opened. Looked at from May 2026, with the benefit of three more months of tape, the period reads as the market's verdict on the entire FY26 PSU power-financier trade rather than a stock-specific pause.

Caption: RECLTD weekly timeframe around 2026-02-12.
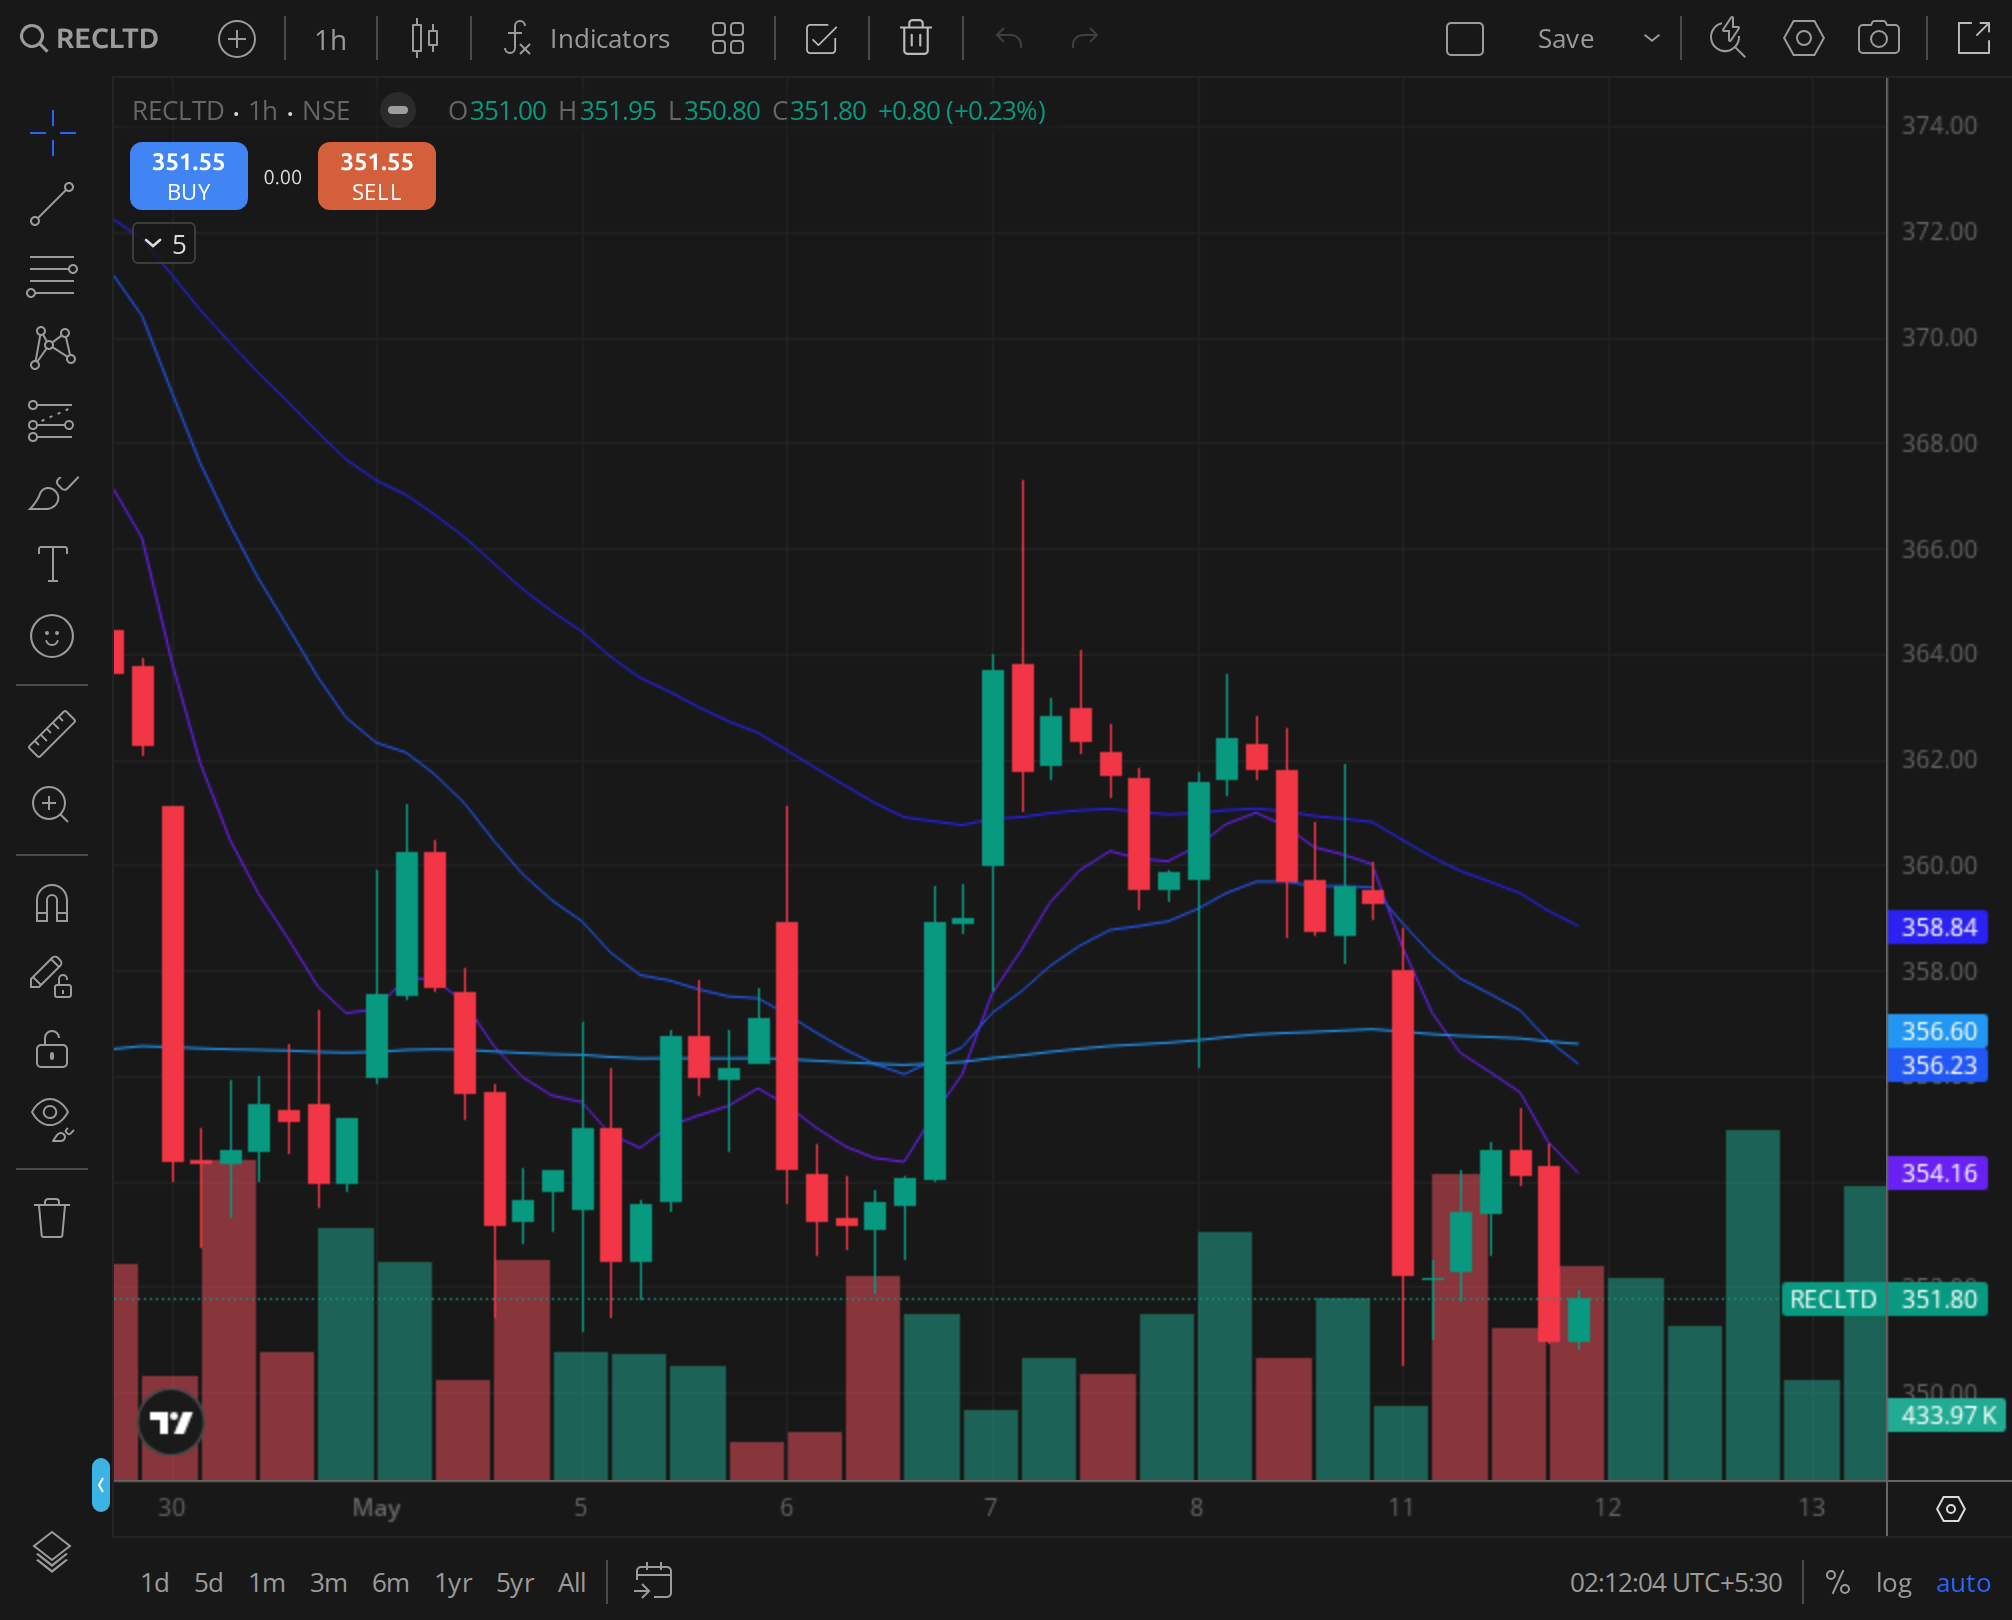
Caption: RECLTD daily timeframe around 2026-02-12.

Caption: RECLTD 30min timeframe around 2026-02-12.
Reading it as anything else, including a healthy consolidation, was the more popular interpretation through January. It was also the wrong one.
The weekly structure said the trend had already changed
The weekly chart was where the conviction problem first showed up.
Through CY24 and the first half of CY25, RECLTD had behaved like a textbook PSU re-rating, with the kind of stair-step weekly structure that comes when domestic institutions decide a sector is structurally re-priced. By the December 2025 monthly close, that step pattern had flattened. The weekly candles inside the brief's window were a sequence of small bodies and overlapping wicks, the visual signature of a stock where neither side wanted to commit size. There were no expansion bars, no closes outside the prior week's range with conviction, and no follow-through on either of the two attempts to push toward the upper rail of the band.
Two facts mattered more than any single candle. First, the weekly structure had stopped making higher highs months before this window opened. Second, every rally inside the ₹460 to ₹495 corridor was sold into before the next week's print. That is a behavioural signature traders have learned to respect on PSU names where retail and HNI ownership is high and free-float liquidity is moderate. Liquidity providers were happy to sell every push because they knew the marginal buyer was thinning out.
A consolidation that loses its slope is not a consolidation. It is a top.
The fundamental story was already in the price
RECLTD's fundamental case had carried it through FY25 and into FY26 with very little internal debate. The story was familiar to anyone who had run a screen on Indian power financiers through 2024 and 2025. Loan book growth in the mid-teens, gross NPA trending lower, a renewable financing pipeline with multi-year visibility, and the Power Finance Corporation parent group benefiting from the central government's transmission and distribution capex push. By the time RECLTD entered the December 2025 to February 2026 window, the consensus brokerage view across the street was the kind of mild, dutiful constructive that signals a story whose easy money has already been made.
The qualitative read on the quarterly print closest to 12 February was that nothing in the numbers gave bulls a fresh reason to add at the upper end of the band. Net interest income trajectory was steady, asset quality was steady, and disbursement growth was steady. Steady is what you get when a PSU re-rating has done its work. A market that had paid 1.5 to 1.7 times trailing book at the FY25 peak was being asked to defend that multiple on a story whose growth delta had stopped surprising. Without an upside catalyst, the bar to add fresh longs at ₹490 was simply higher than the bar to take some chips off.
There was also a peer dynamic that did not get enough airtime in January. Power Finance Corporation, the parent and the obvious comparable, traded with a similar structure through this window. When two stocks in the same sub-sector show the same overhead failure on the same time frame, the right inference is sectoral, not idiosyncratic. The institutional desks that had owned the PSU power-financier theme as a basket for two years were beginning to unwind it as a basket. RECLTD's chart was just the cleanest expression of that.
The daily tape was where the distribution showed up
If the weekly chart told you the trend had changed, the daily chart told you who was doing the selling.
The 200-day moving average sat as a shelf above the price for most of the window. RECLTD made multiple attempts to base above it and failed each time. None of those failures were dramatic. There was no single capitulation candle, no gap-down on a Monday after a weekend headline. The stock simply could not hold above the level for more than a session at a time. The daily moving average stack rolled over with the kind of unhurried negative slope that distinguishes a cyclical top from a panic.
Volume signature on the daily was the second tell. Through January, the up-day volumes inside the band were lighter than the down-day volumes. That asymmetry, persistent across three to four weeks, is one of the most reliable footprints of institutional distribution in Indian large caps. Domestic mutual funds had been net buyers of PSU financials through most of FY25. By January and early February 2026, the flow data that emerged later in the quarter showed that the marginal flow into the basket had turned. RECLTD, which had been a high-conviction overweight in many actively managed PSU funds, was being trimmed into strength.
The 4% drawdown from the window's opening level, finalised at the 27 February close, was less a verdict than an arithmetic result of that flow asymmetry compounding for nine weeks.
Sentiment, the option chain, and what the FIIs did
The derivatives picture in the days bracketing 12 February was consistent with everything the cash market was already saying.
Open interest on the ₹500 strike call had been steadily building through the front half of February, behaving like a cap rather than a magnet. ₹460 puts had begun to attract writing, but with the spot trading inside the band, neither side carried strong conviction. The put-call ratio sat in a neutral band that gave the indicator zero predictive value, which is itself information. When option positioning gives no signal, the cash market's behaviour gets the casting vote, and the cash market was telling you supply was winning.
FII derivative positioning in single-stock futures on RECLTD through this window did not show the kind of aggressive short build that precedes a sharp directional move. What it showed instead was a steady reduction of net long exposure. That is the more dangerous configuration for a stock at the upper end of a band. Outright shorts can be squeezed. Long unwinds simply remove the bid. The stock did not crash because nobody was pressing it. The stock could not rally because the natural buyer had stepped back.
Brokerage flow through the window was where the editorial discipline of the sell side did not match the discipline of the trading desks that read the same brokers' models. Most house views remained constructive. A couple of target prices were trimmed by single-digit percentages. None of the major desks went outright cautious on the name during the brief's window itself, which in hindsight was a lagging response. The downgrades, when they came, came later in the spring.
A historical analog from RECLTD's own tape
REC Limited had traded a similar setup once before in its post-2020 re-rating, in the second half of 2023. That earlier episode followed the same template. A multi-quarter uptrend, a several-week consolidation against an overhead moving average, declining volume on bounces, and an eventual resolution to the downside that lasted one to two months before a fresh base formed at lower levels.
The fractal nature of the rejection was the most useful tell for active traders. The intraday tape in the week leading into 12 February rhymed with the daily tape across the full window. Pushes higher in the first half of a session were sold by the second half. Closing prints clustered toward the lower third of the day's range on more sessions than not. Traders who pattern-matched off the 2023 analog had a clean playbook. Sell rallies, do not chase weakness, and wait for the band to break before sizing up either direction.
That is exactly what the most disciplined desks did, and it is why the eventual resolution lower, when the band finally gave way after the brief's window closed, did not feel like a surprise to anyone who had been reading the tape rather than the headlines.
Was the move justified, ex post?
Looking back from May 2026, the answer is yes, and for the most boring possible reason. The market was not pricing a new piece of bad news into RECLTD through that window. The market was simply re-rating a story whose easy gains were behind it down to a multiple that better reflected its forward growth. The 4% drawdown into the window's close was the early instalment of that adjustment, not the whole bill.
The five-day forward read off 12 February was, accurately, a continuation of the same indecision rather than a clean break. The band held for the rest of February. The actionable trade was not the breakout call that several technical newsletters were waiting for. The actionable trade was the patient short or the underweight, sized to a horizon that respected how slowly PSU re-ratings unwind.
For investors, the lesson was simpler still. When a sector basket loses its slope on the weekly time frame, the strongest name in the basket is not a refuge. It is the cleanest exit.
Verdict
Stance: BEARISH (as read from the 12 February 2026 vantage) Horizon: 1 month forward from focus date Rationale: Weekly structure had already lost its slope, daily volume signature confirmed institutional distribution, derivative positioning showed long unwinds rather than fresh shorts, and the fundamental story offered no incremental catalyst to defend the upper end of the ₹460 to ₹495 band. The 4% drawdown into the window's close was the early instalment, not the full repricing.