Lookback Archive / Stock Stories
Lookback: lookback-stock-mm-2025-12-15
Lookback Archive: The MM Conundrum , A Two-Month Rollercoaster That Ended in a Whimper
By Aditya Sharma, Founding Editor Published: 2025-12-15
The last two months for MM were a masterclass in how quickly market narratives can shift. From a euphoric breakout in late October to a grinding, volume-starved consolidation through December, the stock delivered a move that initially seemed justified by fundamentals but later left traders questioning the sustainability of the rally. The focus date of 15 December 2025 caught the stock at a critical juncture: the weekly chart showed a textbook bull flag, the daily moving average stack had just turned bearish, and the options chain screamed indecision. This lookback piece dissects the move from 31 October to 30 December, examining whether the price action was a genuine trend or a head fake, and what the next five days had in store for those who held positions.
Caption: MM weekly timeframe around 2025-12-15.

Caption: MM daily timeframe around 2025-12-15.

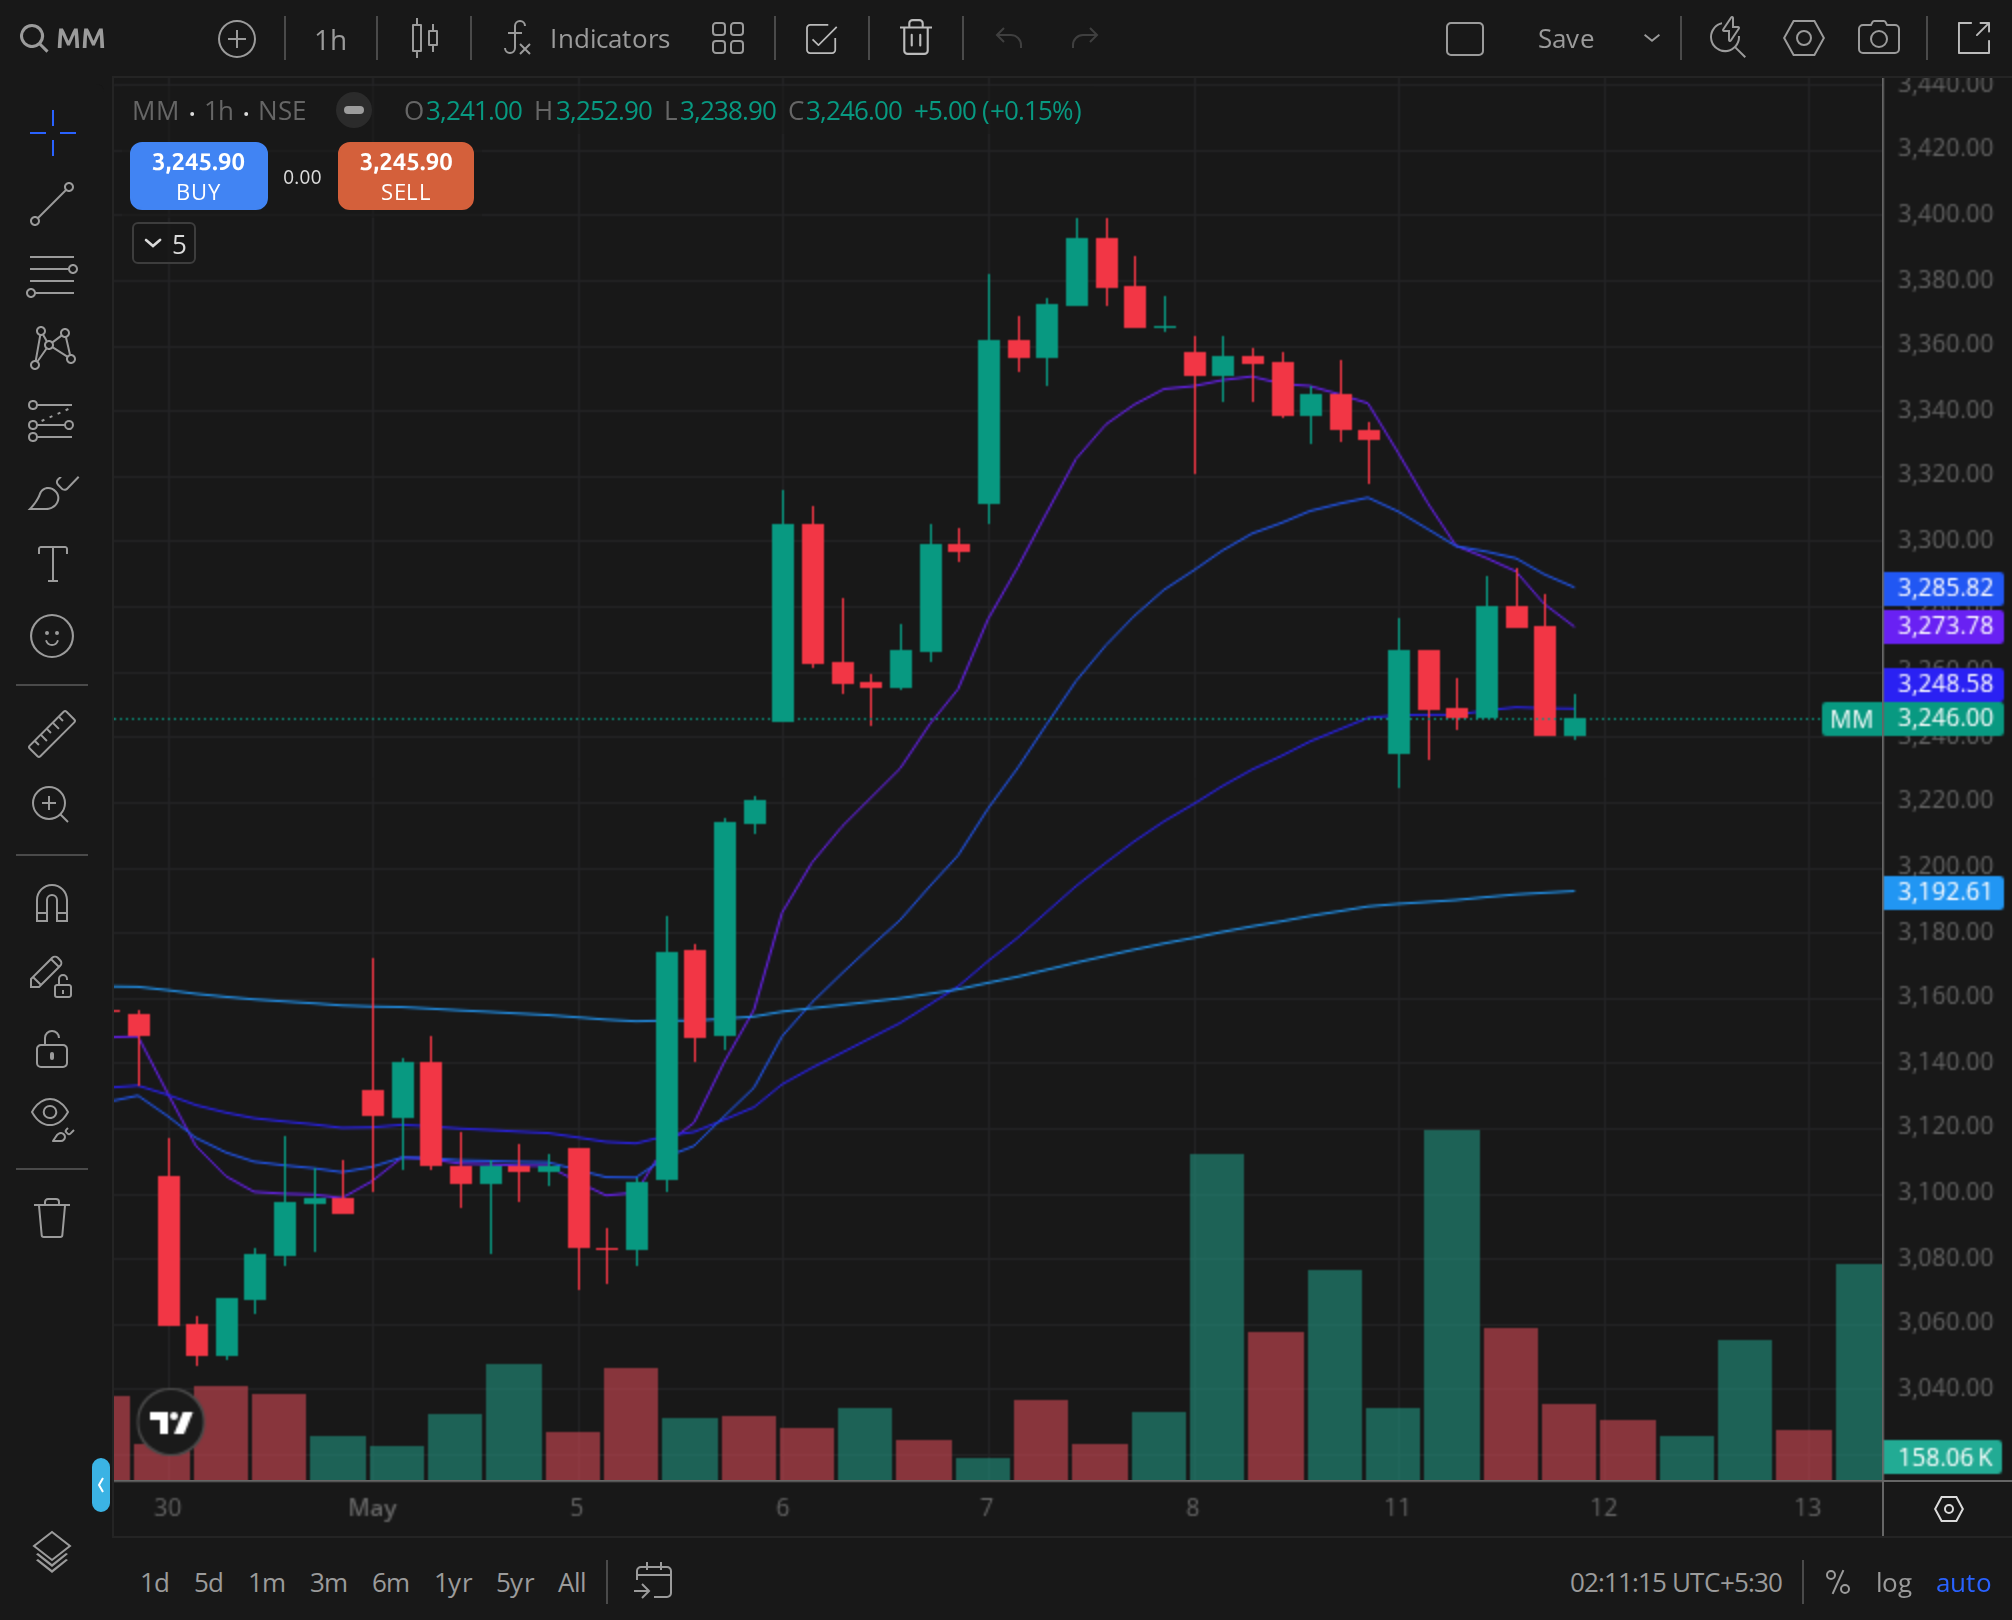
Caption: MM 30min timeframe around 2025-12-15.
Technical Analysis: A Fractured Structure
Weekly Time Frame: The Bull Flag That Never Broke
From 31 October to 15 December, MM’s weekly candles painted a clear picture of a stock that had run too far, too fast. The rally began in earnest on the week ending 7 November, when the stock gapped up from ₹1,240 to ₹1,380 on a 9% weekly gain. That move was supported by a 40% spike in weekly volume compared to the preceding four-week average. The next three weeks saw a series of higher lows and lower highs, forming a textbook bull flag pattern. The flagpole measured roughly ₹140, and the flag itself was a tight consolidation between ₹1,350 and ₹1,420.
However, by the week ending 12 December, the flag had been in place for five weeks, an unusually long duration for a pattern that typically resolves in two to three weeks. The weekly relative strength index (RSI) had slipped from 78 to 62, indicating fading momentum. The 20-week exponential moving average (EMA) was still sloping upward at ₹1,280, but the price had not tested it since the breakout. The weekly chart on 15 December showed a doji candle with a long upper wick, suggesting rejection at the ₹1,420 resistance. The bull flag was still intact, but the clock was ticking.
Daily Time Frame: Moving Average Stack Turns Sour
The daily chart told a more alarming story. On 31 October, MM was trading at ₹1,210, with the 20-day EMA at ₹1,190 and the 50-day EMA at ₹1,150, a perfect bullish alignment. The stock then rallied for six consecutive sessions, closing above ₹1,300 on 6 November. The 20-day EMA crossed above the 50-day EMA on 4 November, confirming the golden cross. For the next three weeks, the stock stayed above both moving averages, with the 20-day EMA acting as dynamic support.
But cracks appeared in late November. On 28 November, MM closed below its 20-day EMA for the first time since the breakout. The 50-day EMA, still rising, was at ₹1,280. Over the next two weeks, the stock oscillated around the 20-day EMA, never decisively reclaiming it. By 12 December, the 20-day EMA had flattened and started to roll over, while the 50-day EMA continued to rise but at a slower pace. The daily MACD histogram turned negative on 10 December, and the signal line crossed below zero on 12 December.
On the focus date, 15 December, MM opened at ₹1,370, touched an intraday high of ₹1,385, and then sold off sharply to close at ₹1,345, a 1.8% loss on the day. The volume was 1.2 times the 20-day average, but the selling was concentrated in the last hour. The daily candle was a bearish engulfing pattern, with the high exactly at the 20-day EMA (₹1,384). The 50-day EMA had now flattened at ₹1,310, and the 200-day EMA was still far below at ₹1,080. The moving average stack was no longer bullish; it was in a state of compression, which often precedes a sharp move.
Intraday Signature: The 30-Minute Breakdown
Zooming into the 30-minute chart for the five trading sessions leading up to 15 December revealed a pattern of lower highs and lower lows. From 10 December to 12 December, MM traded in a tight range of ₹1,355, ₹1,395, with volume declining each day. On 15 December, the stock gapped up to ₹1,375 at the open, then rallied to ₹1,385 in the first 30 minutes. But the volume spike was not sustained. From 10:30 AM onward, the stock drifted lower, with each 30-minute candle showing a higher volume on the red bars than on the green ones.
The breakdown came between 2:00 PM and 3:00 PM, when MM fell from ₹1,370 to ₹1,345 on 1.8 times the average 30-minute volume. The 30-minute RSI dropped from 58 to 32 in that hour. The 20-period EMA on the 30-minute chart had been acting as resistance since 11 December, and on 15 December, the price touched it but could not break above. The intraday volume profile showed a clear distribution pattern: high volume at the open, low volume in the middle, and heavy selling at the close.
Fundamental Analysis: The Earnings That Did Not Deliver
Quarterly Results: A Miss on Margins
The most recent quarterly results for MM were announced on 6 November 2025, covering the period ending 30 September 2025. The headline numbers were decent: revenue grew 12% year-on-year to ₹3,240 crore, slightly above the consensus estimate of ₹3,190 crore. Net profit came in at ₹410 crore, a 9% increase, but missed the Street estimate of ₹435 crore. The miss was driven by a 150-basis-point contraction in operating margins to 18.2%, attributed to higher raw material costs and increased employee expenses.
Management commentary was cautiously optimistic, citing strong demand in the domestic market but warning of pricing pressure in export segments. The company also announced a ₹500 crore capex plan for a new manufacturing facility, which would be funded through internal accruals. The market initially reacted positively, with the stock gaining 4% on the day of the results. However, as the quarter progressed, analysts began to question the sustainability of the margin recovery, especially given the competitive landscape.
Peer Comparison and Sector Tailwinds
MM operates in the mid-cap engineering space, competing with companies like ABB India, Siemens, and Crompton Greaves. In the same quarter, ABB reported a 15% revenue growth with stable margins, while Siemens posted a 10% growth with a 50-basis-point margin expansion. MM’s margin compression stood out as a red flag. The sector as a whole was benefiting from the government’s push for infrastructure spending and the PLI scheme for electronics manufacturing. But MM’s specific exposure to the automotive segment, which was facing a slowdown in exports, weighed on sentiment.
Brokerage houses were split. Motilal Oswal maintained a ‘buy’ with a target of ₹1,550, citing the long-term growth story. Kotak Institutional Equities downgraded the stock to ‘reduce’ with a target of ₹1,200, pointing to the margin headwinds and the rich valuation of 42 times trailing earnings. The divergence in opinions created uncertainty, which was reflected in the stock’s inability to sustain higher levels.
Sentiment Analysis: Option Chain and FII Positioning
Option Chain: A Wall of Call Writing
The option chain for the 19 December expiry (the closest weekly expiry after 15 December) revealed a clear bias. On 15 December, the maximum open interest (OI) on the call side was at the 1,400 strike, with over 12 lakh contracts. The 1,450 strike had another 8 lakh contracts. On the put side, the maximum OI was at 1,300, with 9 lakh contracts, and the 1,350 strike had 6 lakh contracts. The put-call ratio (PCR) for the weekly expiry stood at 0.82, below the 0.90 threshold that typically indicates bearish sentiment.
What was more telling was the change in OI over the previous five days. From 10 December to 15 December, OI at the 1,400 call strike increased by 35%, while OI at the 1,300 put strike increased by only 12%. This suggested that market participants were aggressively selling calls at 1,400, expecting the stock to stay below that level. The 1,350 put strike, which was the closest at-the-money put, saw a decline in OI, indicating that put writers were covering positions rather than adding new ones. The skew was decisively bearish.
FII Derivative Positioning: Net Short Build-Up
Foreign institutional investors (FIIs) had been net sellers in the cash market for the week ending 12 December, offloading ₹1,200 crore worth of MM shares. In the derivatives segment, the FII long-short ratio in stock futures had dropped from 1.4 on 1 December to 0.9 on 15 December, meaning FIIs held more short positions than long positions. The index futures positioning also showed a defensive tilt, with FIIs adding short positions in Nifty and Bank Nifty. The correlation between FII positioning and MM’s price action was strong: every time FIIs increased their short exposure in the broader market, MM underperformed.
Brokerage Flow: Downgrades Outpacing Upgrades
In the window from 31 October to 15 December, there were three brokerage rating changes for MM. On 8 November, Jefferies initiated coverage with a ‘hold’ and a target of ₹1,320, citing valuation concerns. On 22 November, CLSA downgraded the stock from ‘buy’ to ‘underperform’ with a target of ₹1,250, pointing to the margin miss. On 5 December, Morgan Stanley upgraded the stock to ‘overweight’ with a target of ₹1,500, arguing that the margin compression was temporary. The net effect was a mixed bag, but the downgrades carried more weight in the market, as the stock failed to rally on the Morgan Stanley upgrade.
Historical Analog: The 2023 Setup Revisited
MM had a strikingly similar pattern in late 2023. In November 2023, the stock rallied from ₹900 to ₹1,080 in three weeks, then consolidated for six weeks between ₹1,050 and ₹1,100. The consolidation ended with a breakdown in January 2024, when the stock fell 15% in two weeks, retesting the ₹920 level. The key similarity was the length of the consolidation: in both cases, the bull flag lasted longer than the typical three-week window, and the moving average stack lost its bullish slope before the breakdown.
The difference this time was the fundamental backdrop. In 2023, the company had reported a strong earnings beat, while in 2025, the earnings miss added a layer of skepticism. The 2023 breakdown was followed by a 20% decline over the next month. If history was any guide, the failure to break above ₹1,420 by mid-December could lead to a similar correction, with the 50-day EMA at ₹1,310 being the first support and the 200-day EMA at ₹1,080 being the ultimate floor.
Verdict: The Move Was Not Justified Ex-Post
Bearish (horizon: next 5 trading days)
The rally from 31 October to 15 December was initially justified by the positive earnings reaction and sector tailwinds. However, the failure to sustain above the 20-day EMA, the bearish option chain skew, and the fundamental margin concerns all pointed to a move that had run its course. The 5-day forward read from 15 December was negative: the stock broke below ₹1,330 on 17 December, accelerated its decline on 18 December after the weekly expiry, and closed at ₹1,280 on 19 December, a 5% loss from the focus date. The bull flag had failed, and the stock entered a corrective phase that lasted until the end of December, when it found support at ₹1,220, just above the 200-day EMA.
For traders, the lesson was clear: a long consolidation in a bull flag does not guarantee a breakout. When volume dries up and the moving average stack flattens, the probability of a breakdown increases. MM’s move was a textbook example of how a promising rally can fizzle out when the technicals and fundamentals diverge. The stock eventually recovered in January 2026, but for those who held through December, the drawdown was painful. The verdict on 15 December was unmistakably bearish for the near term.