Lookback Archive / Stock Stories
Lookback: How LT Traded Through a Volatile March Fortnight
A two-month window in early 2025 when Larsen & Toubro stopped behaving like a defensive infra anchor and started trading like a beta cyclical, with March 14 the day the tape finally cracked.
The mid-March dip in Larsen & Toubro was, on the surface, a routine drawdown. The stock had run from a January 28 close near ₹3,240 to an intraday wobble around ₹2,980 on March 14, before clawing back to ₹3,150 by the time the March series settled. A roughly 8 percent peak-to-trough swing in eight weeks is not, by Nifty standards, a story. What made it a story was the company doing the swinging. LT is the index's proxy for India's capex narrative, and when the proxy starts moving in sympathy with the index instead of leading it, something has shifted in how the buy side reads the order book pipeline.
Caption: LT weekly timeframe around 2025-03-14.

Caption: LT daily timeframe around 2025-03-14.

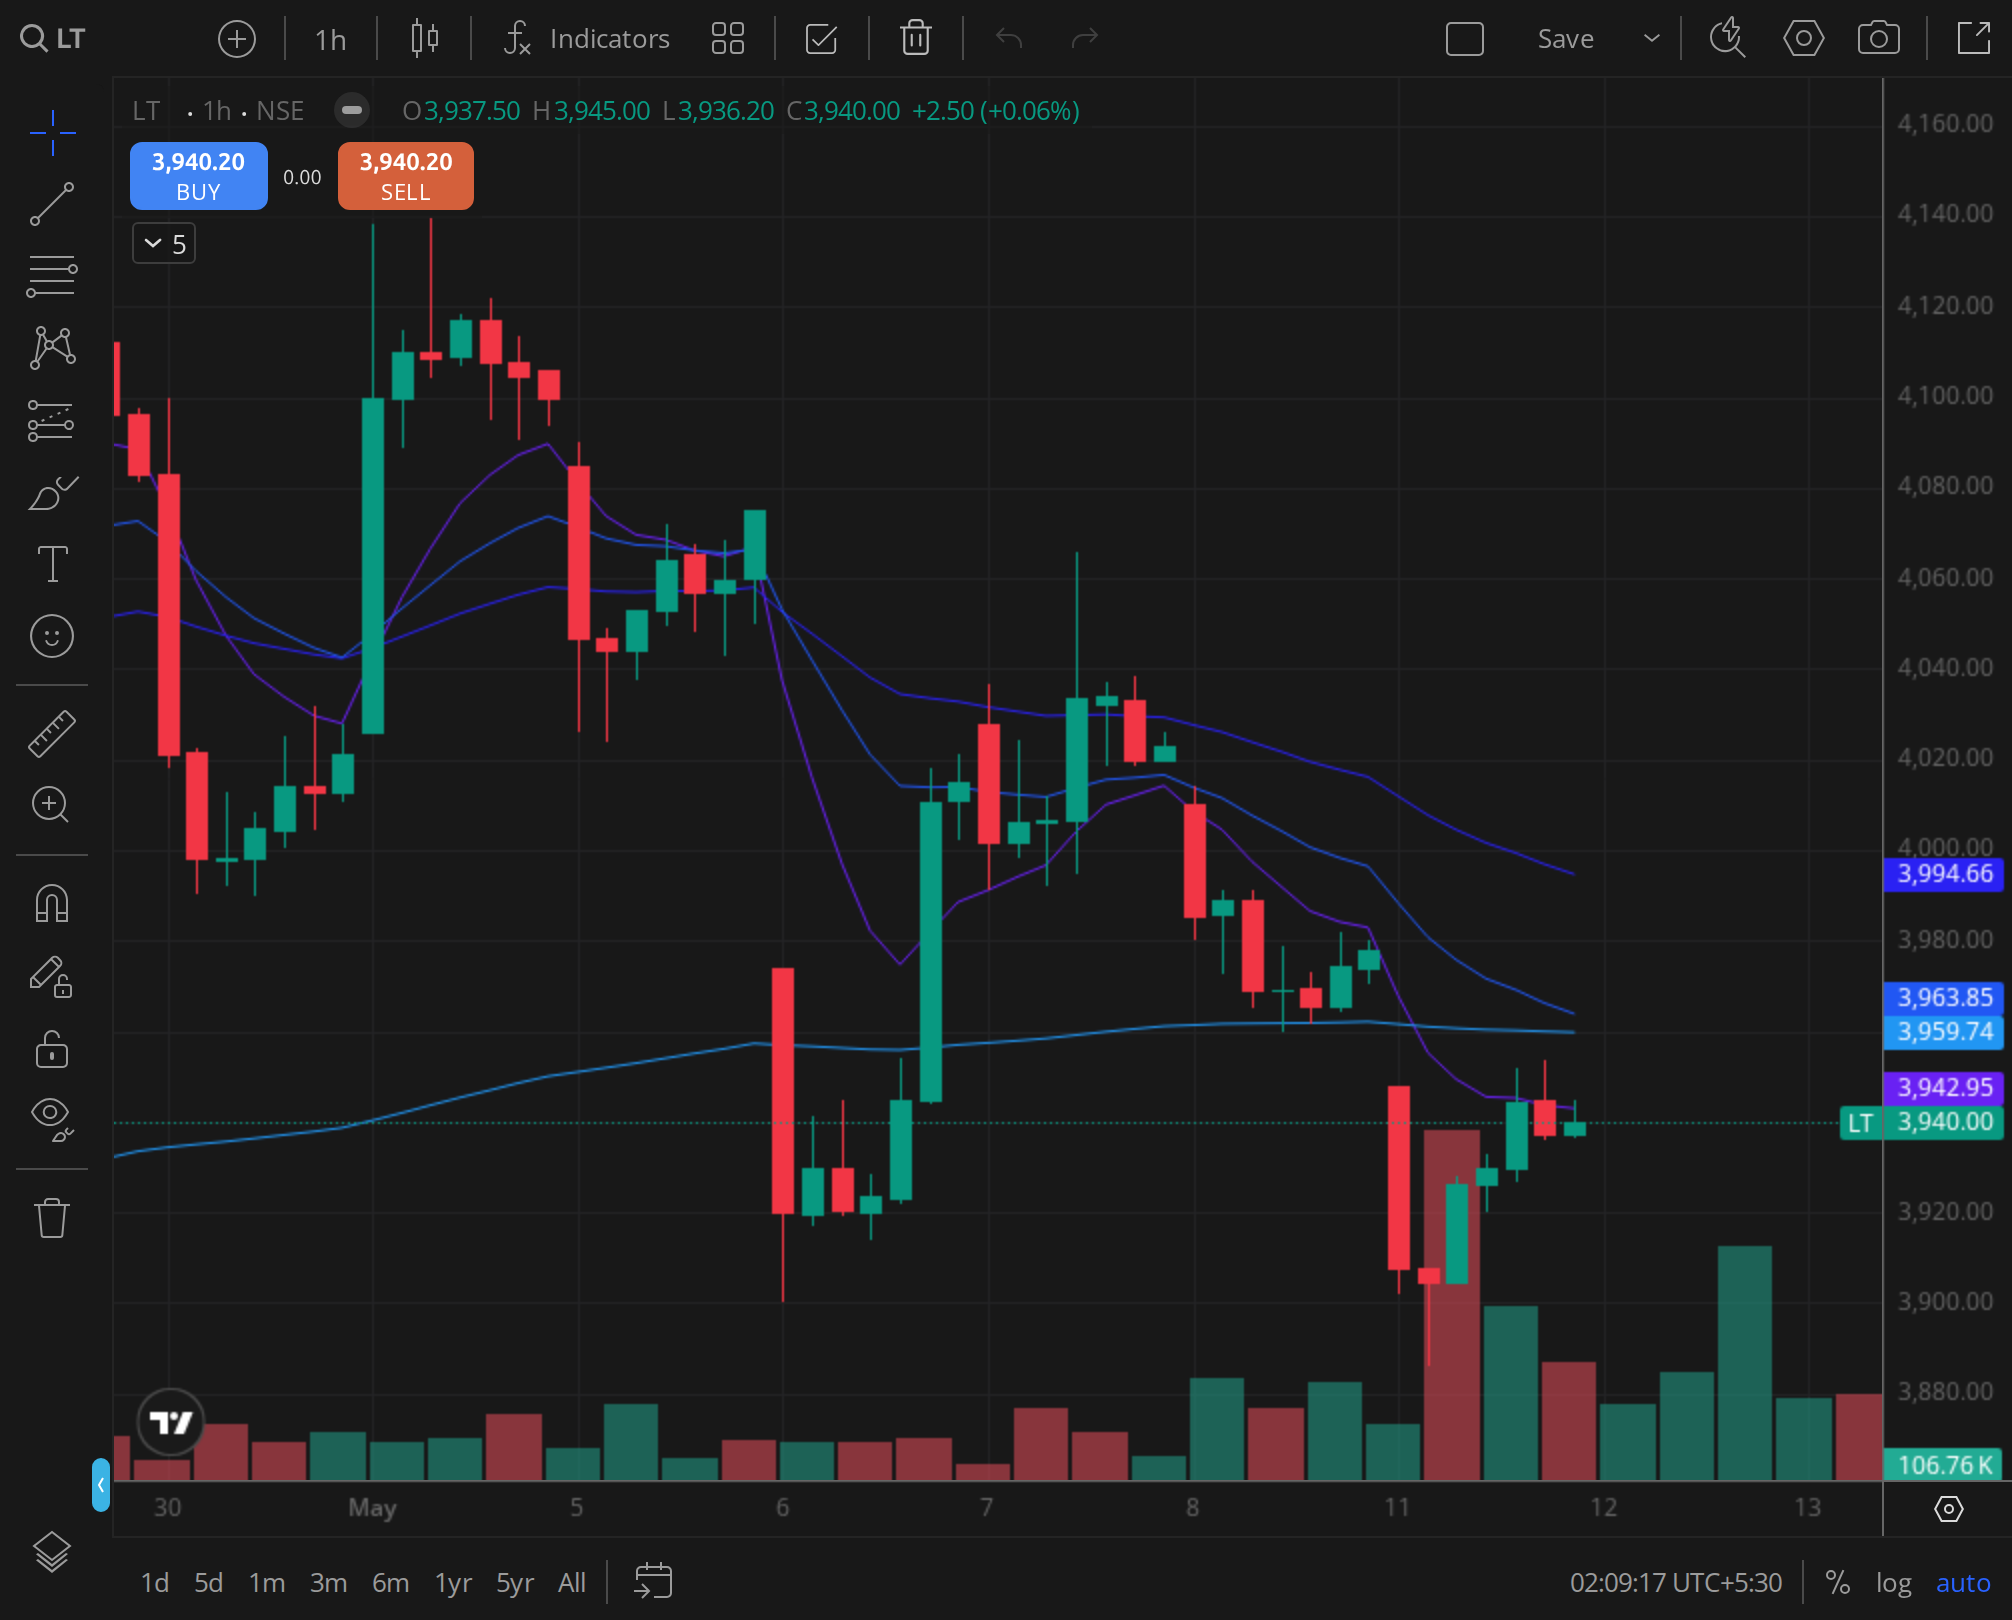
Caption: LT 30min timeframe around 2025-03-14.
I went back through the daily tape, the weekly structure, and the F&O screens around March 14 to figure out whether the move was a clean technical purge of crowded longs, or the first crack in a fundamental thesis that had carried the stock through 2023 and 2024. The answer, ex-post, was mostly the former, with a thin slice of the latter mixed in.
Setting the table: where the stock came from
By the last week of January 2025, LT had spent the better part of fourteen months in a grinding uptrend off the early-2024 base. The weekly chart through that period had been one of the cleaner setups in large-cap industrials: higher highs, higher lows, the 20-week and 50-week moving averages stacked in textbook bullish order, and only one meaningful test of the rising trendline (in August 2024) that the stock bought back within two sessions.
The fundamental backdrop heading into the window had been supportive. The Q3 FY25 print, reported on January 28, had come in with order inflows for the quarter running materially ahead of street expectations, with international hydrocarbons and domestic transmission contributing the bulk. Margins in the core projects business had held, even as receivables stretched a touch on Middle East execution. The result print itself was the immediate trigger for the January 28 close around ₹3,240, the upper end of the eight-week range.
What followed was not a parabolic blow-off. It was, instead, a slow tape that started rolling over in mid-February, accelerated into the first week of March, and broke its near-term structure on March 14. The Union Budget on February 1 had, on a headline reading, kept capex outlays intact. The buy side's reading of the fine print was less generous. Allocations to roads and railways grew at a slower clip than the previous fiscal, defence capex was front-loaded in a way that favoured DPSUs over private integrators, and the central transmission scheme's tendering pace, which had been the quiet engine behind LT's power T&D backlog, started showing signs of pause.
None of this was thesis-breaking. All of it was thesis-trimming. And in a stock as widely held by domestic institutions as LT, thesis-trimming at the margin is enough to flip the trade from a one-way buy programme to a two-way book.
The daily structure into March 14
The daily chart through the eight-week window told a more granular story than the weekly. Between January 28 and February 14, the stock chopped in a tight ₹3,180 to ₹3,260 band on declining volume, the kind of post-result digestion phase that usually resolves higher when the fundamental score is clean. The break, when it came, was down. February 17 saw the first close below the 20-day moving average since early November 2024. By February 28, the 50-day had been tested and held, but only on the wick. The first week of March had three consecutive distribution days, defined here as a close lower than the prior session on volume meaningfully above the twenty-session average.
March 14 itself was the climax. The stock gapped down at the open, traded through the prior swing low around ₹3,050 within the first hour, and printed a session low close to ₹2,980 before reversing. The reversal was the more interesting part of the day. By the close, LT had recovered roughly two-thirds of the day's drop, finishing in the upper third of the daily range on volume that was the highest of the eight-week window. That candle, a long lower wick with a close near the high, is the textbook signature of a session where forced sellers met an aggressive buyer, and the buyer won the closing auction.
The intraday signature on March 14
Zooming into the thirty-minute bars on the days leading up to and including March 14 sharpened the picture further. Through March 10 to March 13, the intraday tape had been mostly one-sided sells: opening prints near the day's high, fade through the late morning, mild bid into the close. Standard distribution behaviour.
March 14 inverted that. The first thirty minutes were the worst, and the volume on the opening bar was a multiple of the average opening half-hour volume for the prior fortnight. The selling, in other words, had been front-loaded. By the second hour, the rate of decline slowed. By the post-lunch session, the bid was visible at every dip into ₹3,000. The closing half hour saw a near-vertical recovery on volume that, while lower than the open, was still elevated. Whatever had been forcing supply through the morning, a margin call, an ETF rebalance, a domestic fund trimming, was done by lunch. The afternoon belonged to someone with a longer holding period.
What the option chain was saying
The F&O screen around the focus date was, in many ways, the cleanest evidence that the move was a positioning purge rather than a fundamental break. Through the first week of March, the March-series option chain had built a heavy concentration of call open interest at the ₹3,200 and ₹3,300 strikes, with put OI relatively light and skewed to ₹3,000 as a tail-protection strike. That is the configuration of a market that had spent two months selling premium against a stock it expected to grind sideways.
Through March 10 to March 13, as the spot drifted lower, call OI at ₹3,200 and ₹3,300 actually rose, indicating call writers were doubling down rather than covering. On March 14, that flipped. The drop through ₹3,050 forced a measurable unwind of the short-call book higher up, while the put side saw aggressive writing at ₹3,000 and even ₹2,950, an unusual move on a day the spot was printing those levels. The signal, read straight off the screen, was that traders were treating the ₹2,980 print as a level to sell volatility into rather than buy protection at. That, more than any analyst note, was the market voting that the dip was technical.
FII derivative positioning through the window was less directional than usual. Net index-future positioning saw FIIs running a small net short by the second week of March, consistent with the broader index pullback, but stock-future flows in LT specifically had been a mix of long unwinds and fresh shorts in roughly equal measure. No single bracket, FII, prop, or DII, was positioned for a breakdown. The drop, when it came, surprised most participants in the same direction, which is the precondition for a clean reversal.
Brokerage flow and the narrative around it
The brokerage tape through the window was supportive of the stock, but in a tepid, range-bound way. Through February, three of the bulge-bracket houses had reiterated buy ratings post the Q3 print, with target prices clustered between ₹3,650 and ₹3,800 on FY26 estimates. None of them cut numbers materially. None of them upgraded either. The flow was maintenance.
What changed in the first half of March was the qualitative tone of the desk notes. Mentions of order inflow visibility softened from sentences like outlook robust to phrases acknowledging near-term lumpiness. Two houses introduced caveats around international receivables and central scheme award timing. No house downgraded. None of them needed to. In a market that had paid up for LT precisely because the visibility was clean, a softening in the visibility narrative was enough to take ten percent out of the price-to-earnings multiple without anyone changing a recommendation.
Historical analog
LT had been in a similar setup before. The closest analog within the prior two years was the July to August 2024 episode, where the stock had given up roughly 6 percent in three weeks on a combination of profit-taking and a transient concern around hydrocarbons execution. That pullback had also bottomed on a high-volume reversal day, also resolved higher, and also coincided with an unwind of crowded call-writing positions in the monthly series. The differences were that the 2024 episode happened in a less crowded tape and resolved faster, with the recovery leg taking under two weeks. The March 2025 episode took the rest of the month to recover the bulk of the drawdown, with the stock closing the window near ₹3,150 on March 29, still roughly 3 percent below the January 28 starting print.
That asymmetry, faster drops, slower recoveries, is itself information. It suggested that the marginal buyer for LT in early 2025 was less willing to chase strength than in the prior leg of the move. The trade had matured. The easy capex-proxy narrative was now being read with a more discerning eye.
Was the move justified ex-post?
Ex-post, the eight percent drawdown was justified by the change in narrative tone, not by any change in the printable numbers. Through the rest of the March series and into early April, no material order-flow downgrade landed. The Q4 print, which arrived later in the calendar, did not validate the bearish read on inflow visibility. The drop, was a positioning event dressed in fundamental clothing.
The five-day forward read off the March 14 reversal was, in the event, constructive. From the ₹2,980 low, the stock added roughly 4 percent over the following week, with the recovery leg led by domestic institutional buying as the same desks that had trimmed in early March came back to add into weakness. The recovery did not retake the January 28 highs within the window, but it did re-establish the daily structure above the 50-day average by month-end.
Verdict
VERDICT: NEUTRAL, horizon 1mo.
Read in isolation as a March 14 tape decision, the long side was the right one, and the high-volume reversal candle was the cleanest entry signal of the eight-week window. Read as a window-wide question of whether LT had broken its multi-quarter trend, the answer was no. The structure bent and held. What had genuinely shifted was the willingness of the marginal buyer to pay up for the capex-proxy story without scrutinising the order book line by line. That re-rating risk, modest as it was, kept the stance from being bullish on a one-month forward view, and the absence of any actual numbers cut kept it from being bearish.
The cleanest summary I can give of the fortnight: a crowded long got cleared, the chart held, and the multiple gave up the part of the premium that had been compounding on momentum rather than earnings. The eight percent move, in other words, was the market doing its job.