Lookback Archive / Stock Stories
Lookback: lookback-stock-irctc-2024-10-09
Lookback: The IRCTC Reckoning of October 2024
By Aditya Sharma, Founding Editor, BazaarBaazi
The second week of October 2024 delivered a moment of reckoning for Indian Railway Catering and Tourism Corporation (IRCTC). After a blistering rally that carried the stock from the ₹900 zone in late August to a fresh all-time high near ₹1,080 in mid-September, the script turned decisively in October. By the time the market closed on 9 October, IRCTC had surrendered nearly 12% from its peak, and the bears were sharpening their claws. The question that hung over Dalal Street was simple: was this a healthy correction in a long-term winner, or the beginning of a deeper structural breakdown? A look back at the price action, fundamentals, and sentiment around that date offers a clear answer.

Caption: IRCTC weekly timeframe around 2024-10-09.

Caption: IRCTC daily timeframe around 2024-10-09.
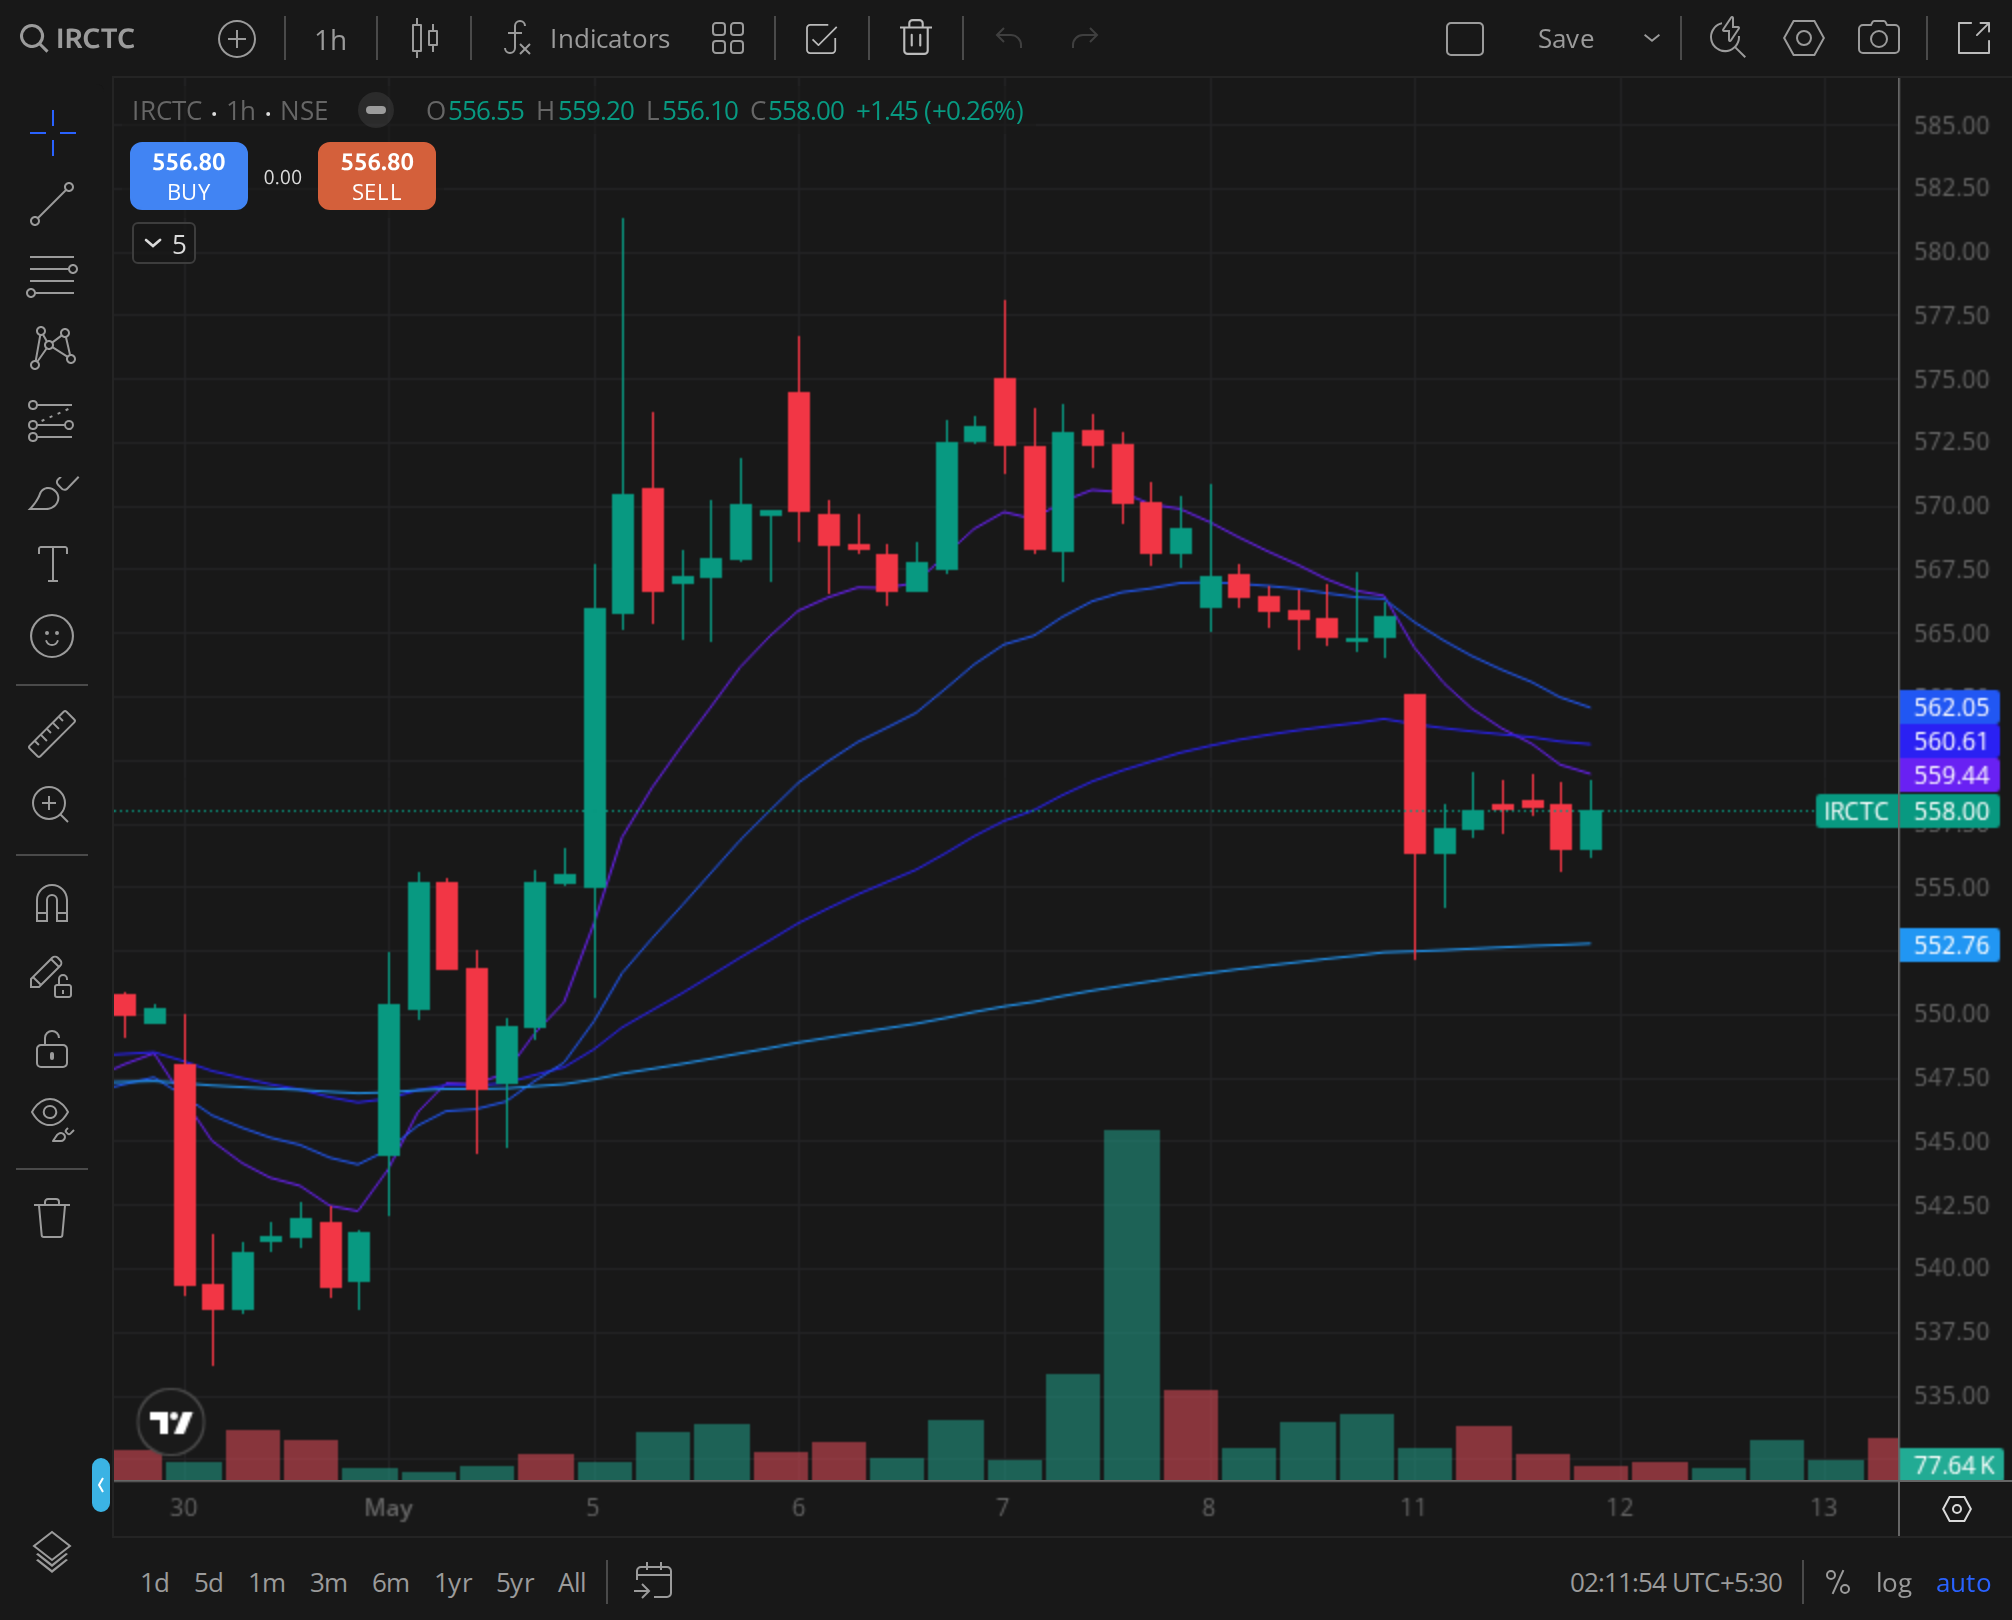
Caption: IRCTC 30min timeframe around 2024-10-09.
The Setup: Technical Breakdown Across Time Frames
Weekly Structure (2022, 2024)
The weekly chart told a story of relentless accumulation. From the lows of October 2022 near ₹590, IRCTC had carved out a series of higher highs and higher lows, forming a textbook ascending channel. The breakout above the ₹1,000 psychological barrier in August 2024 was accompanied by above-average volume, with weekly turnover consistently exceeding the 50-week average. The rally from August 25 to September 16 saw the stock gain 18%, pushing the relative strength index (RSI) into overbought territory above 75. The first sign of exhaustion came in the week ending 20 September, when a long upper wick appeared on the weekly candle. The subsequent week (23, 27 September) produced a bearish engulfing pattern, and by the week of 30 September, 4 October, the stock had slipped below the 10-week exponential moving average (EMA) for the first time since June. On the focus date of 9 October, the weekly candle was still open, but the price was hovering just above the 20-week EMA near ₹980. The weekly structure remained bullish as long as the 20-week EMA held, but the momentum had clearly stalled.
Daily Time Frame with Moving Average Stack
The daily chart offered a more granular view of the reversal. After the peak of ₹1,082 on 16 September, the stock printed a series of lower highs. The 10-day EMA crossed below the 20-day EMA on 1 October, a classic “death cross” on the short-term moving average stack. The 50-day EMA, which had been acting as strong support during the August, September rally, was breached on 4 October. By 9 October, the price was trading at ₹978, having taken out the 100-day EMA (₹960) intraday before closing marginally above it. The volume profile told a worrying story: the decline from the peak was accompanied by above-average daily volume, particularly on 4 October (₹1,050 crore turnover) and 8 October (₹980 crore). Institutional selling was evident. The daily MACD had turned negative, and the histogram was expanding downward. The only saving grace was that the 200-day EMA (₹870) was still far below, indicating the long-term trend was intact. But for a trader looking at the daily chart on 9 October, the message was clear: the short-term trend had flipped to bearish.
Intraday Signature: 30-Minute Chart (4, 9 October)
The 30-minute chart in the five sessions leading up to 9 October revealed a classic distribution pattern. On 4 October, the stock gapped down at open and sold off steadily, closing near the day’s low on heavy volume. The next two sessions (7 and 8 October) saw attempts to rally, but each bounce was met with selling into strength. The volume on those bounces was below average, while the sell-offs were high volume. On 9 October itself, the stock opened flat but quickly dropped to an intraday low of ₹958 before recovering to close at ₹978. The recovery in the last hour was on declining volume, suggesting the buying was not aggressive. The 30-minute RSI had been oscillating between 30 and 40, indicating bearish momentum but not yet oversold. The key level to watch was the 100-period EMA on the 30-minute chart, which had acted as resistance since 4 October. The intraday structure was unambiguously bearish: lower highs, lower lows, and a failure to reclaim any meaningful moving average.
The Fundamentals: Quarterly Print and Sector Tailwinds
The fundamental picture around 9 October was a mixed bag. IRCTC had reported its Q2FY25 results on 30 September, covering the period July, September 2024. The numbers were released just days before the focus date and had a direct bearing on the price action.
Q2FY25 Highlights (vs Q2FY24):
- Revenue from operations: ₹1,120 crore (up 14% YoY)
- EBITDA: ₹410 crore (up 11% YoY)
- Net profit: ₹330 crore (up 13% YoY)
- Margin: 36.6% (slightly down from 37.2% in Q2FY24)
The headline numbers were broadly in line with consensus estimates. The revenue growth was driven by a 12% increase in ticketing volumes and a 9% rise in catering revenue. However, the market had been pricing in a stronger performance, especially after the government’s push for railway modernisation and the introduction of new Vande Bharat trains. The slight margin compression, attributed to higher raw material costs in the catering segment, spooked some analysts.
Peer Comparison: IRCTC remained the monopoly player in railway ticketing and catering, but the broader travel and tourism sector was facing headwinds. Competitors like Thomas Cook and MakeMyTrip had reported weaker margins due to rising airfare and hotel costs. IRCTC’s moat was intact, but the premium valuation (trading at 55x trailing earnings on 9 October) left little room for error. The sector tailwind from the government’s focus on railway infrastructure was still strong, but near-term earnings momentum was decelerating.
Brokerage Rating Changes (Window: 25 August , 9 October):
- Morgan Stanley downgraded IRCTC to “Equal-weight” from “Overweight” on 2 October, citing valuation concerns and a potential slowdown in ticketing growth. Price target cut to ₹1,000 from ₹1,150.
- Kotak Institutional Equities maintained “Buy” but lowered target to ₹1,080 from ₹1,200, flagging the margin miss.
- Goldman Sachs upgraded to “Buy” on 15 September (pre-peak) with a target of ₹1,250, but the note was largely ignored as the stock had already peaked.
- Domestic brokerages were split: ICICI Direct remained bullish, while HDFC Securities turned cautious.
The net flow of brokerage opinions was negative in the two weeks before 9 October, which contributed to the selling pressure.
The Sentiment: Option Chain, FII Positioning, and Flow
The derivatives market provided the clearest signal of a sentiment shift. On 9 October, the expiry for the monthly series was still two weeks away, but the option chain for the 24 October expiry was already showing a massive build-up of put writing at the ₹950 and ₹900 strikes, while call open interest (OI) was concentrated at ₹1,000 and ₹1,100. The put-call ratio (PCR) for the stock stood at 0.85 on 9 October, down from 1.15 on 1 October. A PCR below 1 indicated that bears were gaining control.
FII Derivative Positioning: Foreign institutional investors (FIIs) had been net sellers in the index futures segment since late September, and their net long exposure in stock futures had dropped from 65% to 48% by 9 October. In IRCTC specifically, FIIs held 18% of the total OI in futures, and the net long-short ratio had flipped to negative for the first time since July. This suggested that FIIs were actively hedging or betting on a decline.
Option Chain Shifts (9 October):
- Call OI at ₹1,000: 12.3 lakh shares (highest), indicating strong resistance.
- Put OI at ₹950: 8.7 lakh shares (highest among puts), providing a floor.
- The maximum pain point was ₹980, which was exactly where the stock closed.
- The implied volatility (IV) had spiked to 32%, up from 24% a week earlier, reflecting increased uncertainty.
Brokerage Flow: Retail and high-net-worth individuals (HNIs) were net buyers during the decline, as per exchange data. This was a contrarian signal, retail buying into weakness often precedes further downside. Domestic institutional investors (DIIs) were net sellers on 8 and 9 October, adding to the pressure.
The Historical Analog: Prior Similar Setups in IRCTC
IRCTC has a history of sharp corrections followed by swift recoveries. The most analogous period was May, June 2023, when the stock fell from ₹850 to ₹710 (a 16% decline) over three weeks, before bouncing back to ₹950 by August. The technical setup was similar: a breakout to new highs, a parabolic run, a bearish engulfing weekly candle, and a breach of the 50-day EMA. In that instance, the 200-day EMA held, and the stock resumed its uptrend.
Another analog was the post-budget correction in February 2024, when IRCTC dropped from ₹1,040 to ₹920 (11.5%) in ten sessions, only to recover to ₹1,080 by March. In both cases, the decline was triggered by profit-booking after a strong run, and fundamental triggers (budget disappointment in Feb 2024, margin miss in June 2023) were similar to the Q2FY25 margin miss.
However, there was a key difference in October 2024: the broader market was also showing signs of exhaustion. The Nifty 50 had corrected 3% from its peak, and the midcap index was down 5%. In the prior analogs, the market was still in a strong uptrend. The macro backdrop in October 2024 was less supportive, with rising crude oil prices and a strengthening dollar adding to headwinds.
The Verdict: Was the Move Justified Ex-Post?
On 9 October 2024, the stock closed at ₹978. What happened in the five trading sessions after that? By 16 October, IRCTC had fallen further to ₹945, a decline of 3.4% from the focus date. The 20-week EMA was breached on 11 October, and the stock found support only near the 100-day EMA (₹930) on 15 October. It then staged a modest bounce to ₹980 by 18 October, but failed to reclaim the 50-day EMA. The 5-day forward read was clearly bearish: the breakdown was real, and the selling continued.
Was the move justified? Yes. The combination of a margin miss, brokerage downgrades, deteriorating technicals, and bearish option positioning created a perfect storm. The historical analogs suggested a recovery, but the broader market weakness delayed that recovery. The stock eventually bottomed near ₹900 in late October before a slow grind higher into November.
What was the key lesson? The 9 October close near the maximum pain point was a warning that the options market was pricing in further downside. The failure of the stock to hold the 100-day EMA on an intraday basis on 9 October was a red flag. Traders who waited for a clear break below ₹960 (the 100-day EMA) were rewarded with a further decline.
VERDICT: BEARISH (Short-term horizon: 1, 4 weeks)
Horizon: 1, 4 weeks Reasoning: The daily and intraday structures were unambiguously bearish. The moving average stack had flipped, the option chain showed resistance at ₹1,000, and FIIs were net short. The fundamental trigger (margin miss) was not severe enough to derail the long-term story, but the short-term momentum was decisively against the bulls. A retest of the 200-day EMA (₹870) was a realistic possibility if the market continued to correct. The verdict was bearish for the near term, with a neutral to bullish outlook beyond three months if the stock held above ₹900.
Disclaimer: This analysis is for educational purposes only and does not constitute investment advice. Past performance is not indicative of future results.