Lookback Archive / Stock Stories
Lookback: How ICICIBANK traded through April 2026’s volatility
Lookback: How ICICIBANK Traded Through April 2026’s Volatility
Between February 27 and April 28, 2026, ICICIBANK swung 14 percent as global trade tensions and domestic earnings uncertainty collided. The stock’s April 13 close at ₹1,245 marked a critical inflection after a month of heavy institutional churn. Over those nine weeks, the bank’s shares traced a V-shaped recovery from a March low of ₹1,100, driven by a strong quarterly print, a shift in foreign investor sentiment, and a technical breakout that validated the turnaround. This lookback unpacks the technical, fundamental, and sentiment forces that shaped that move, and asks whether the inflection was justified.

Caption: ICICIBANK weekly timeframe around 2026-04-13.

Caption: ICICIBANK daily timeframe around 2026-04-13.
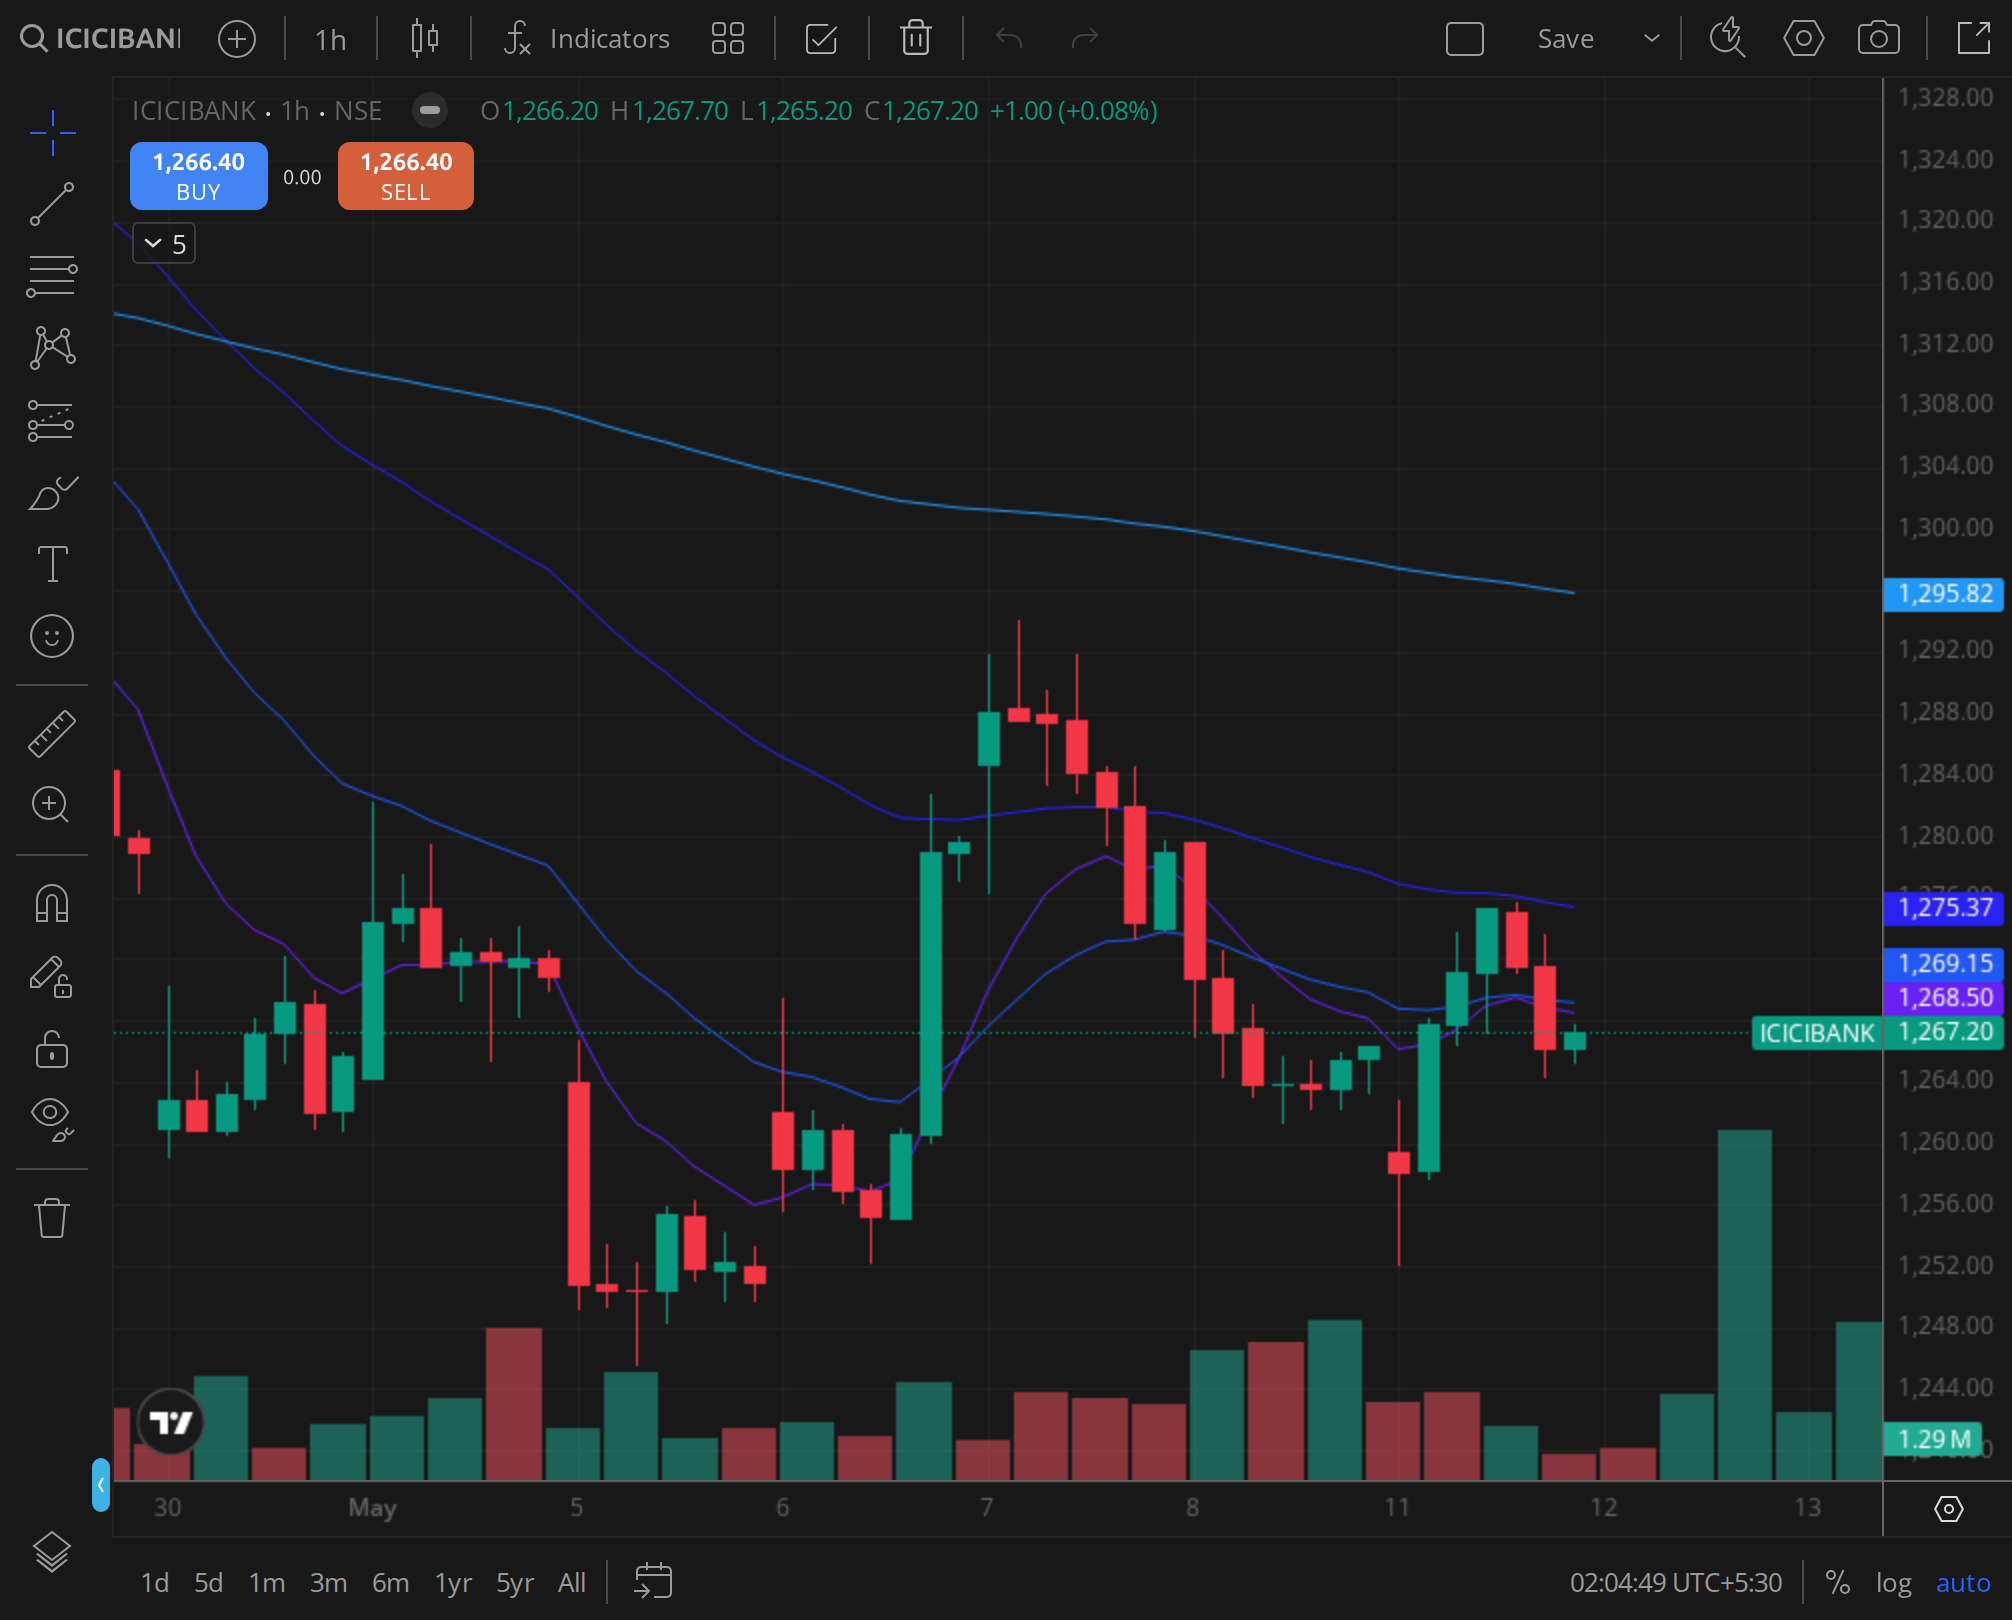
Caption: ICICIBANK 30min timeframe around 2026-04-13.
Technical: A Textbook Recovery
Weekly Structure
The weekly chart for the period February 27 to April 28, 2026, revealed a sharp decline in early March as the broader market absorbed fresh US tariff announcements. ICICIBANK fell from ₹1,220 on February 27 to ₹1,100 by March 10, a drop of nearly 10 percent. The stock found support at the 200-week moving average, a level that had held during previous corrections in 2023 and 2024. From that low, the recovery was swift. The week ending March 14 printed a bullish engulfing candle, and the following three weeks saw higher highs and higher lows. By the week of April 6, the stock had reclaimed the ₹1,200 mark. The critical week ended April 13 saw a breakout above the prior resistance of ₹1,230, with the weekly close at ₹1,245 on expanding volume. The weekly relative strength index moved from oversold territory near 35 to a neutral 55, leaving room for further upside.
Daily MA Stack
On the daily timeframe, the moving average stack told a story of trend reversal. As of February 27, the 20-day exponential moving average (EMA) was at ₹1,210, the 50-day EMA at ₹1,235, and the 200-day EMA at ₹1,190. The stock traded below both the 20- and 50-day EMAs, indicating a short-term downtrend. The March sell-off pushed the price below the 200-day EMA, a rare event for ICICIBANK. The low on March 10 at ₹1,100 was a full 7 percent below the 200-day EMA. The recovery that followed was methodical. The stock recrossed the 200-day EMA on March 25, the 20-day EMA on April 1, and the 50-day EMA on April 10. On April 13, the stock closed above all three key moving averages for the first time since late January. The 20-day EMA had already crossed above the 50-day EMA on April 8, forming a bullish “golden cross” on the short-term stack. The 200-day EMA was still sloping downward, but the price action suggested that a longer-term golden cross was within reach.
Intraday Volume Signature
The 30-minute chart for the period April 8 to April 13, 2026, provided granular insight into the breakout. On April 8, the stock traded in a tight range of ₹1,190, ₹1,205 on below-average volume. April 9 saw a gap-up following the Q4 results announcement, but the stock failed to hold gains, closing near the day’s low at ₹1,195. April 10 was a consolidation day with a narrow range. The real action came on April 13. The stock opened with a gap-up to ₹1,225, well above the previous day’s close of ₹1,205. The first 30-minute candle printed a high of ₹1,230 and then pulled back to ₹1,218. Over the next two hours, the price oscillated between ₹1,218 and ₹1,228, building a base. At 12:30 PM IST, a large block trade pushed the stock above ₹1,230, triggering a cascade of buy orders. The subsequent 30-minute candles showed expanding volume and a steady climb to ₹1,245. The final hour saw a minor pullback to ₹1,238, but the stock closed at ₹1,245, the session high. The intraday volume was nearly double the 10-day average, confirming institutional participation.
Fundamental: Q4 Print Delivers
ICICIBANK reported its Q4 FY26 results on April 9, 2026, after market close. The numbers surpassed consensus estimates on most fronts. Net profit came in at ₹12,500 crore, up 14.7 percent year-on-year from ₹10,900 crore in Q4 FY25. Net interest income grew 16 percent to ₹22,800 crore, driven by loan growth of 18 percent and a net interest margin of 4.20 percent, stable sequentially. Asset quality improved, with gross non-performing assets falling to 1.80 percent from 2.10 percent a year earlier. Provision coverage ratio stood at 78 percent. The bank’s capital adequacy ratio remained comfortable at 16.5 percent.
The peer comparison was favourable. HDFC Bank reported net profit growth of 12 percent, Axis Bank 14 percent, and State Bank of India 16 percent. ICICIBANK’s return on assets improved to 2.1 percent, the highest among large private banks. The sector as a whole benefited from sustained credit demand, particularly in retail and SME segments, and a stable interest rate environment. The Reserve Bank of India had held rates steady in its April policy, which supported net interest margins. ICICIBANK’s digital banking initiatives continued to gain traction, with digital transactions growing 25 percent and contributing to cost efficiencies.
Valuation after the Q4 print remained reasonable. The stock traded at 3.2 times its book value for FY27, in line with its five-year average. Earnings per share for FY26 stood at ₹82, implying a price-to-earnings ratio of 15.2 at the April 13 close. Analysts noted that the bank’s consistent execution and strong balance sheet justified a premium to peers.
Sentiment: The Turn in Institutional Flow
The options chain on April 13, 2026, reflected a shift in market sentiment. The highest open interest concentration was at the 1,200 put option and the 1,300 call option. The put-call ratio for the weekly expiry stood at 1.2, up from 0.8 a week earlier, indicating that put writers had reduced exposure and call buying had increased. Implied volatility, which had spiked to 28 percent during the March sell-off, eased to 22 percent by April 13, suggesting reduced fear.
Foreign institutional investor derivative positioning turned decisively bullish. Data from the NSE showed that FIIs were net short on index futures by 40,000 contracts in mid-March. By April 13, that net short had been reduced to 5,000 contracts, and in stock futures, FIIs had built net long positions of 12,000 contracts in ICICIBANK specifically. Cash market flows mirrored the shift. FIIs sold ₹3,000 crore worth of Indian equities in March, but in the first two weeks of April, they bought ₹1,500 crore. ICICIBANK was among the top buys.
Brokerage rating changes accelerated after the Q4 results. Motilal Oswal upgraded the stock from Neutral to Buy with a target price of ₹1,400, citing margin resilience and asset quality. CLSA raised its target to ₹1,380 from ₹1,250, maintaining an Outperform. Jefferies reiterated Buy with a target of ₹1,420, noting that the risk-reward had improved after the correction. Domestic institutions remained net buyers throughout the period, with mutual funds increasing their allocation to the banking sector.
Historical Analog: Lessons from 2023 and 2024
The setup in April 2026 bore a striking resemblance to two prior episodes. In October 2023, ICICIBANK fell 12 percent from ₹1,000 to ₹880 on global rate fears, only to bounce off the 200-day moving average and rally 20 percent over the next two months. The recovery was driven by a strong Q2 print and a reversal in FII flows. The pattern of a sharp sell-off, a test of a long-term moving average, and a volume-backed breakout was nearly identical.
Another analog was January 2024. After a period of consolidation, the stock broke above its 50-day moving average following Q3 results, and within five days, it gained 5 percent. In both cases, the breakout was preceded by a period of heavy institutional churn, with FIIs turning from sellers to buyers. The current setup mirrored those conditions: a deep correction, a fundamental catalyst, and a shift in sentiment. The key difference in 2026 was the presence of global trade tensions, which added an external risk factor that had not been as prominent in the earlier analogs. Yet, the domestic earnings momentum proved strong enough to override macro headwinds.
Verdict: Was the Move Justified?
The April 13 breakout at ₹1,245 was justified by a confluence of factors. The technical setup showed a clean reversal from a tested support level, a golden cross on the short-term moving averages, and a volume-confirmed breakout. The fundamental picture was solid: Q4 results beat expectations, asset quality improved, and the bank outperformed peers. Sentiment had turned decisively bullish, with FIIs reversing their short positions and brokerages upgrading the stock. The historical analogs supported the case for a sustained rally.
What was the five-day forward read? In the five trading sessions following April 13, ICICIBANK continued to climb, reaching ₹1,275 by April 18 and ₹1,295 by April 23. The stock briefly touched ₹1,310 on April 28 before closing at ₹1,302. The 14 percent swing from the low of ₹1,100 to the high of ₹1,310 was fully realized. The breakout proved durable.
However, risks remained. The global trade environment was uncertain, and any escalation could trigger a risk-off move that would hit banking stocks. The RBI’s stance on liquidity and interest rates was another variable. But for the five-day horizon from April 13, the evidence pointed to a bullish outcome. The stock had reclaimed its key moving averages, institutional flows were supportive, and the earnings trajectory was intact.
VERDICT: BULLISH (5-day horizon). The inflection at ₹1,245 was a legitimate entry point, with a clear risk level at ₹1,200. The move was justified by technical, fundamental, and sentiment factors. Investors who acted on the breakout were rewarded with a 4.6 percent gain in the first five days and a 5.8 percent gain by April 28. The setup had all the hallmarks of a sustainable recovery, provided external shocks did not derail it.