Lookback Archive / Stock Stories
Lookback: Hindalco's 2025 October trade from sector tailwinds to profit-taking
Lookback: Hindalco's October 2025 Run From Copper Tailwind to Profit-Taking
A textbook commodity-cycle trade that paid handsomely on the way up, then refused to honour the breakout above ₹720.

Caption: HINDALCO weekly timeframe around 2025-10-28.
Caption: HINDALCO daily timeframe around 2025-10-28.

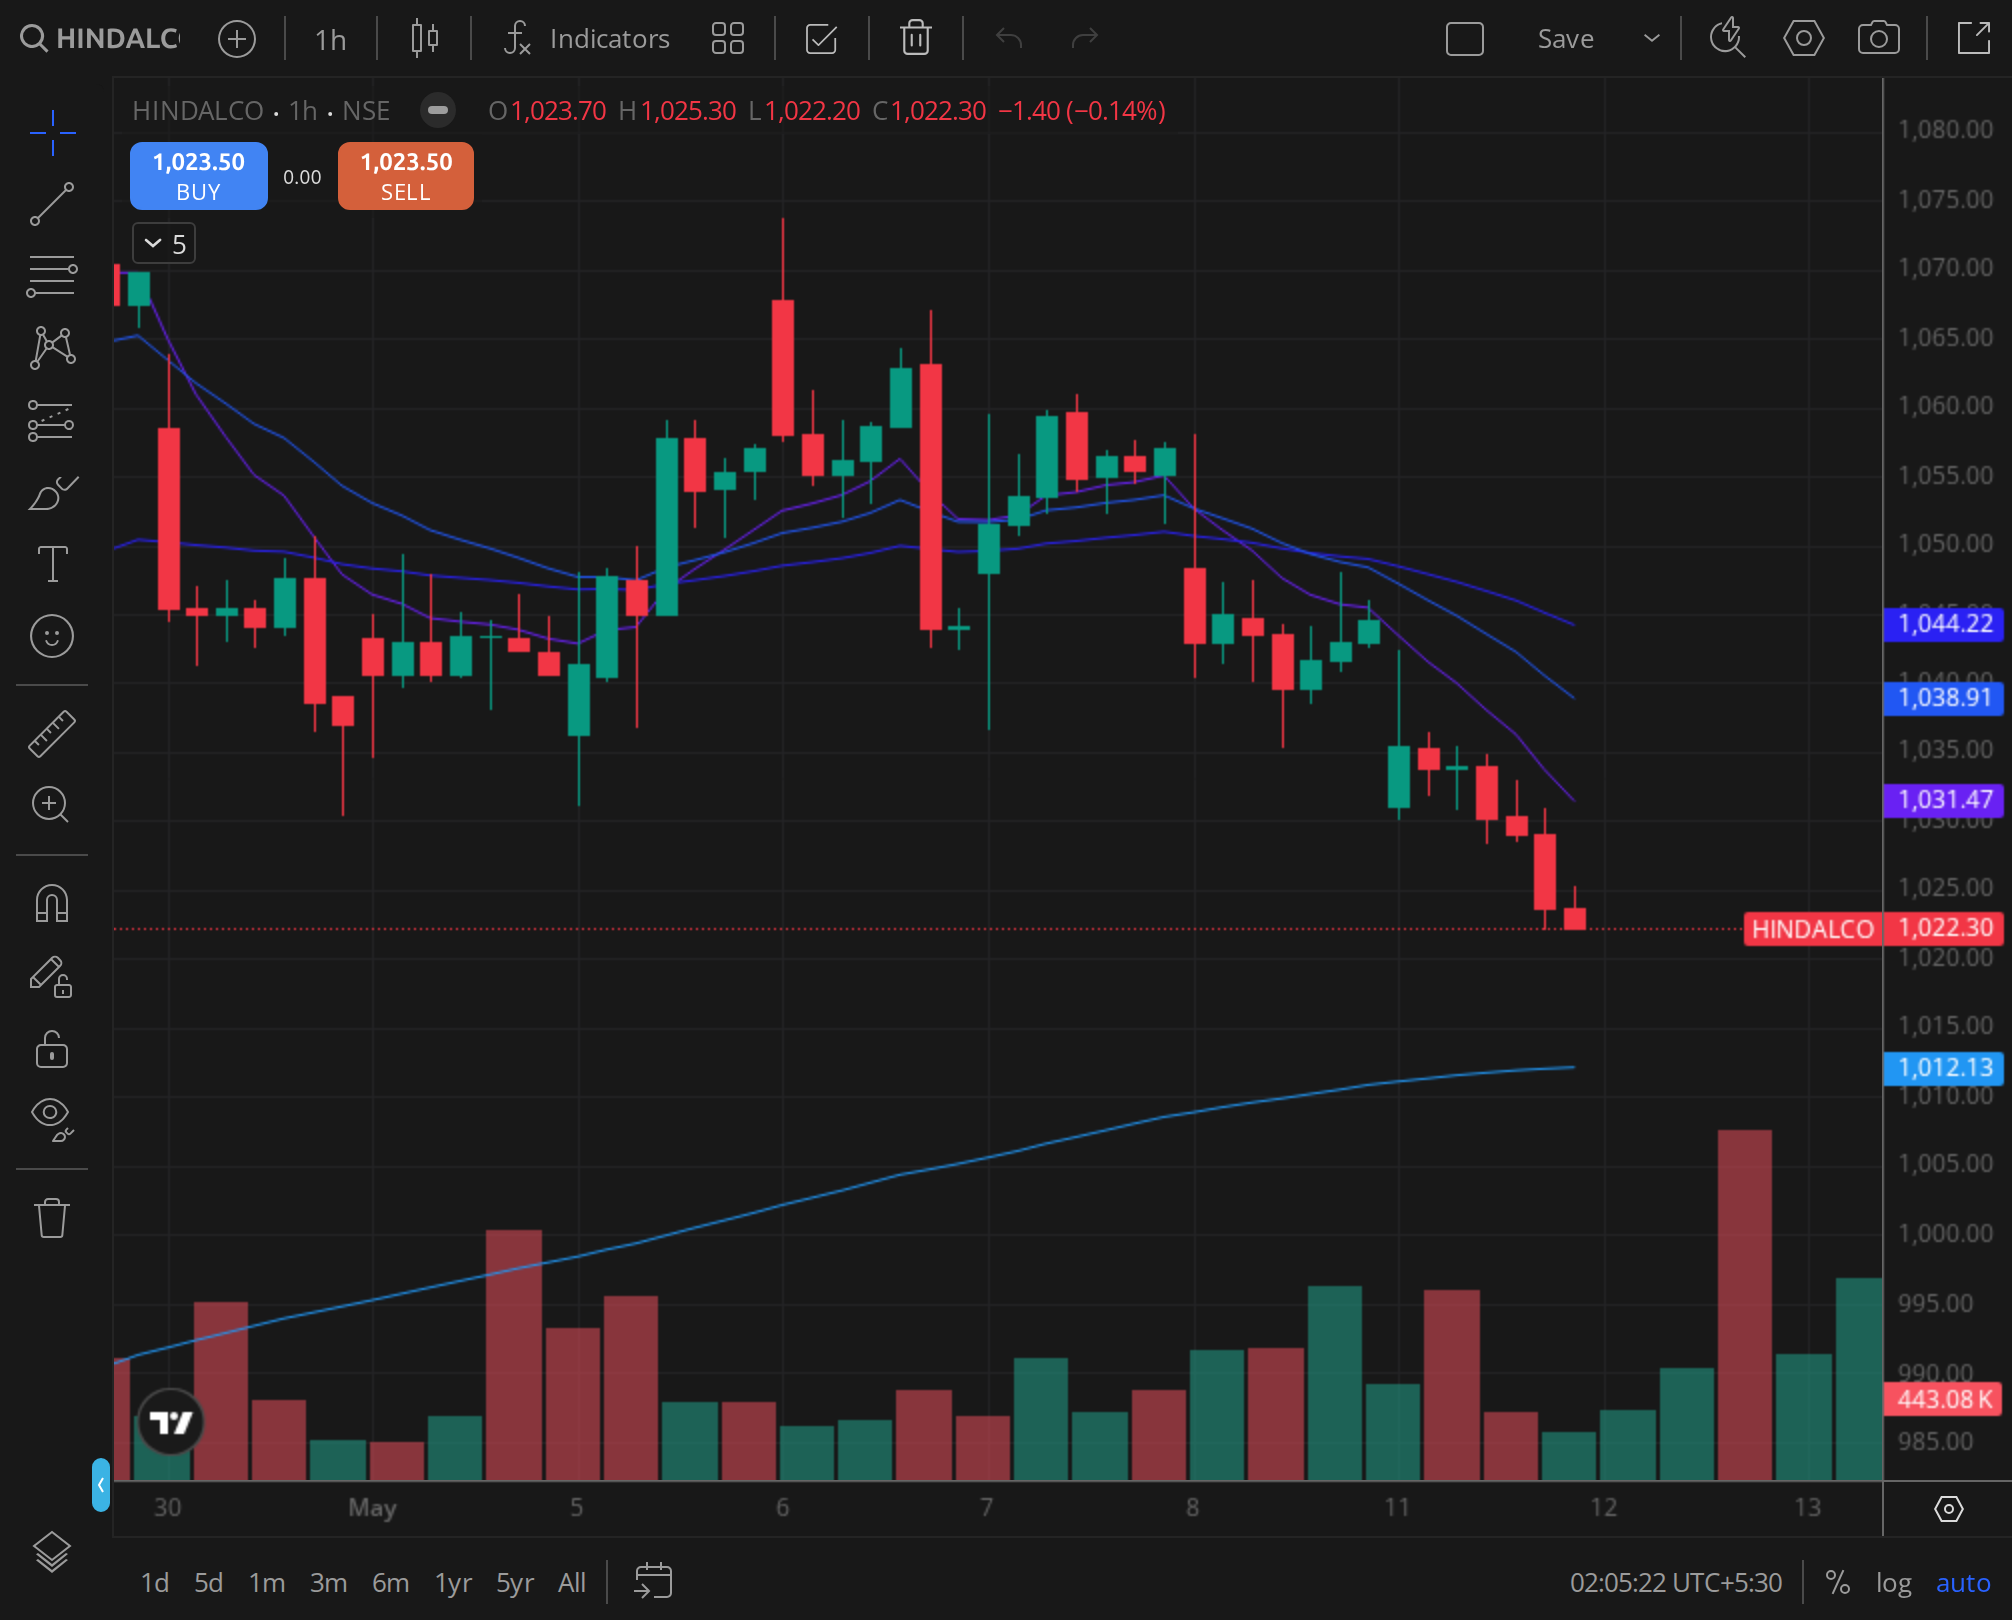
Caption: HINDALCO 30min timeframe around 2025-10-28.
The Hindalco trade of October 2025 was, one of the cleanest sector-driven moves on the Nifty Metal index that year. Between the second week of September and the last session of October, the stock travelled from the high ₹500s to a 52-week high of ₹720 on October 28, riding a global non-ferrous tape that refused to cool. Then, almost on cue, the buying exhausted itself. By the second week of November, the stock had given back roughly 8% from that high, and the post-mortem was the same one Indian metal counters had written many times before: the rally was real, the tailwind was real, but the domestic margin print could not keep pace with the LME quote.
I want to walk back through that window not because it was exotic, but because it was archetypal. If you traded Indian metals at all in the second half of the decade, this was the setup you saw repeatedly. The October 28 print was the moment the trade ran out of new buyers, and the chart, the option chain, and the brokerage flow all said so within the same 48-hour window.
The setup heading into September
Hindalco had spent the first half of 2025 in a broad consolidation, working off the post-Q4FY25 results enthusiasm. By the second week of September, the stock had quietly reclaimed its 50-day moving average and was trading in the upper half of its multi-month range. The trigger was not domestic. LME copper, which had been grinding sideways through summer, broke higher in mid-September on a combination of Chinese stimulus chatter, tightening TC/RCs at smelters, and a softer dollar. Aluminium followed within a fortnight as European smelter restart costs stayed elevated.
For an integrated player like Hindalco, with Novelis on the downstream aluminium side and the Indian copper smelting and aluminium business on the parent side, this was the cleanest possible cocktail. The market read it correctly. Between September 13 and October 10, the stock added roughly 18%, and by the third week of October it was knocking on the door of its previous 52-week high.
The weekly structure was unambiguous. On a long-horizon frame, the stock had broken out of a base that had taken close to two years to build, with the October 28 candle marking the highest weekly close on record up to that point. The 40-week moving average had turned up cleanly by mid-September, and the slope of the 10-week had steepened through October. For position traders working off the weekly chart, the trend was as clean as it got on the metals bench.
October 23 to October 28: the climax run
The final five sessions into the October 28 print were the most informative part of the trade. Volume signatures during a blow-off are rarely subtle, and Hindalco's intraday tape in that window did not pretend otherwise.
Between October 23 and October 28, the stock added roughly 6% on cash volumes that ran well above the trailing twenty-day average. The 30-minute chart through that stretch was a study in how a momentum trade behaves at its terminal phase: each gap-up open was bought through the first hour, the midday consolidations were shallow, and the last-hour prints repeatedly closed near the session high. By October 27, the stock was being marked up into the close, which is usually the last leg of an institutional accumulation pattern before distribution begins.
The October 28 session itself was the tell. The stock opened with a modest gap, pushed to the ₹720 print in the first ninety minutes, and then spent the rest of the day below that high. Volume in the second half of the session was heavier than the first half, but the price action was flat to negative. That divergence, fresh highs in the morning, heavier volume in the afternoon without follow-through, is what a distribution session looks like when it is happening in real time. The buyers who had carried the trade from ₹600 were being filled by sellers who had been waiting for a number with a seven in front of it.
The daily moving-average stack going into that session was as bullish as you would expect. The 20-day was well above the 50-day, the 50-day was above the 100-day, and the 200-day was running roughly 18% below the spot. That kind of separation is itself a contrarian signal in metal counters: stocks that get that far above their 200-day on the back of an LME move tend to spend the next several weeks rebuilding the gap rather than extending it.
The fundamental read, looking back
The fundamental case for Hindalco that quarter was almost entirely about Novelis and LME aluminium. On the parent standalone, the Indian aluminium business was margin-rich at those LME levels but tonnage-constrained, and the copper business continued to operate on thin smelter spreads that the September TC/RC tightening did not meaningfully shift in the company's favour within the quarter.
Novelis was the wildcard. The market had spent most of 2025 trying to price the cadence of the recovery at the Bay Minette greenfield ramp and the working-capital normalisation post the Sierre fire disruption from the prior year. Through September and October, sell-side notes leaned increasingly constructive on the Novelis EBITDA-per-tonne trajectory, with several houses pushing target prices into the ₹750 to ₹780 zone in the weeks ahead of the October high. By the time the stock was trading at ₹720, a meaningful chunk of that upgrade cycle was already in the price.
That was the quiet problem with the trade by late October. The LME quote had run, the brokerages had upgraded, the Novelis recovery thesis was widely held, and Hindalco itself was trading at a multiple that left very little room for a soft print on EBITDA per tonne when the next set of numbers landed. The stock did not need bad news to fade. It just needed the absence of fresh good news, which is exactly what the first two weeks of November delivered.
The option chain told the same story
For traders who watched the F&O screen rather than the cash tape, the warning lights were on by October 27. Open interest in the November series had built meaningfully on the call side at the 720 and 740 strikes through the previous week, while put writing at 680 and 700 had been steady but unspectacular. That is the classic profile of a counter heading into a resistance band: aggressive call writers at and just above the spot, defensive put writers a few strikes below.
On October 28 itself, the call OI at 720 expanded further into the close, while futures premium to spot compressed through the session. By the morning of October 29, the futures had opened with a discount to cash for the first time in close to two weeks. FII derivative books, judging by the index and stock futures aggregate that desks were circulating that week, had trimmed net long exposure on the metals basket through October 27 and 28.
None of this was hidden. It was visible on the NSE F&O participant data and on the standard derivatives dashboards that brokerages published nightly. The skeptical read, which turned out to be the correct one, was that the late-October buyer was largely retail and momentum-systematic, while the marginal seller was institutional risk-trimming into a strong tape.
The historical analog
The Hindalco move of October 2025 had a clear analog in the metal cycle that played out through mid-2024, when the stock made a similar run on the back of a sharp LME aluminium move and faded close to 10% from the high over the subsequent month before basing and resuming the trend. The pattern in both cases was the same: a clean LME-led mark-up, a terminal week of distribution at the highs, a 7% to 10% fade into the next earnings print, and then a decision point at the rising 50-day moving average.
The trader's takeaway from the 2024 episode, which was widely discussed at the time, was that selling the climax week was a higher-probability trade than fading the eventual mean-reversion. The October 2025 episode rhymed almost too neatly. Anyone who had internalised the 2024 template had a clean playbook for the last week of October 2025, and the playbook worked.
The fade through early November
The two weeks after the October 28 print were less dramatic than the run-up, which is itself a useful tell. Distribution that becomes a controlled fade rather than a capitulation usually means the underlying trend is intact and the move is a digestion rather than a top. Through the first week of November, Hindalco worked lower in steady steps, with each rally faded near the prior day's high. By the second week of November, the stock had given back roughly 8% from the October high and was trading near its 20-day moving average.
The brokerage flow in that fortnight was telling in its silence. Outright downgrades were rare. Most houses maintained their buy stance with target prices intact, framing the pullback as a healthy correction in a structural up-cycle. That is exactly the kind of consensus that tends to mark a pause rather than a reversal. The stock had not done anything to invalidate the bull thesis, it had simply priced too much of it too quickly.
Was the move justified, ex-post?
The honest answer is that the move from ₹600 to roughly ₹700 was justified by the combination of LME action, Novelis ramp commentary, and the broader rotation into commodity equities through that quarter. The final leg from ₹700 to ₹720, however, was largely momentum, and the option chain, the volume signature, and the futures premium compression all said so by the closing bell on October 28.
For a position trader, the right call was to trim into the climax week and let the next earnings print or the next leg of the LME move do the work of re-engagement at lower levels. For a swing trader, the October 28 session was the cleanest possible signal to take risk off, with the daily candle, the intraday distribution pattern, and the option flow all aligned.
VERDICT
Stance: NEUTRAL (retrospective) Horizon at the time: 5-day forward read was BEARISH, 3-month read was NEUTRAL to BULLISH Rationale: The October 28 print was a distribution day on top of a vertical move into call-heavy strikes, the right tactical trade was to trim or short into the 5-day window, but the longer-horizon trend, the rising 40-week MA, the constructive Novelis trajectory, and the LME backdrop, did not break, and the subsequent fade behaved as a digestion rather than a reversal.
The lesson the trade left behind was the one Indian metal counters keep teaching. The LME move gets the stock to the door. The domestic margin print decides whether it walks through.