Lookback Archive / Stock Stories
How Godrej Properties traded through Diwali 2024: From September lows to a November breakout
How Godrej Properties Traded Through Diwali 2024: From September Lows to a November Breakout
A 449-rupee move in six weeks, a 50-DMA reclaim on real volume, and a realty tape that finally remembered why it loved this name. The setup deserved a second look long after the trade had cooled.

Caption: GODREJPROP weekly timeframe around 2024-11-05.

Caption: GODREJPROP daily timeframe around 2024-11-05.
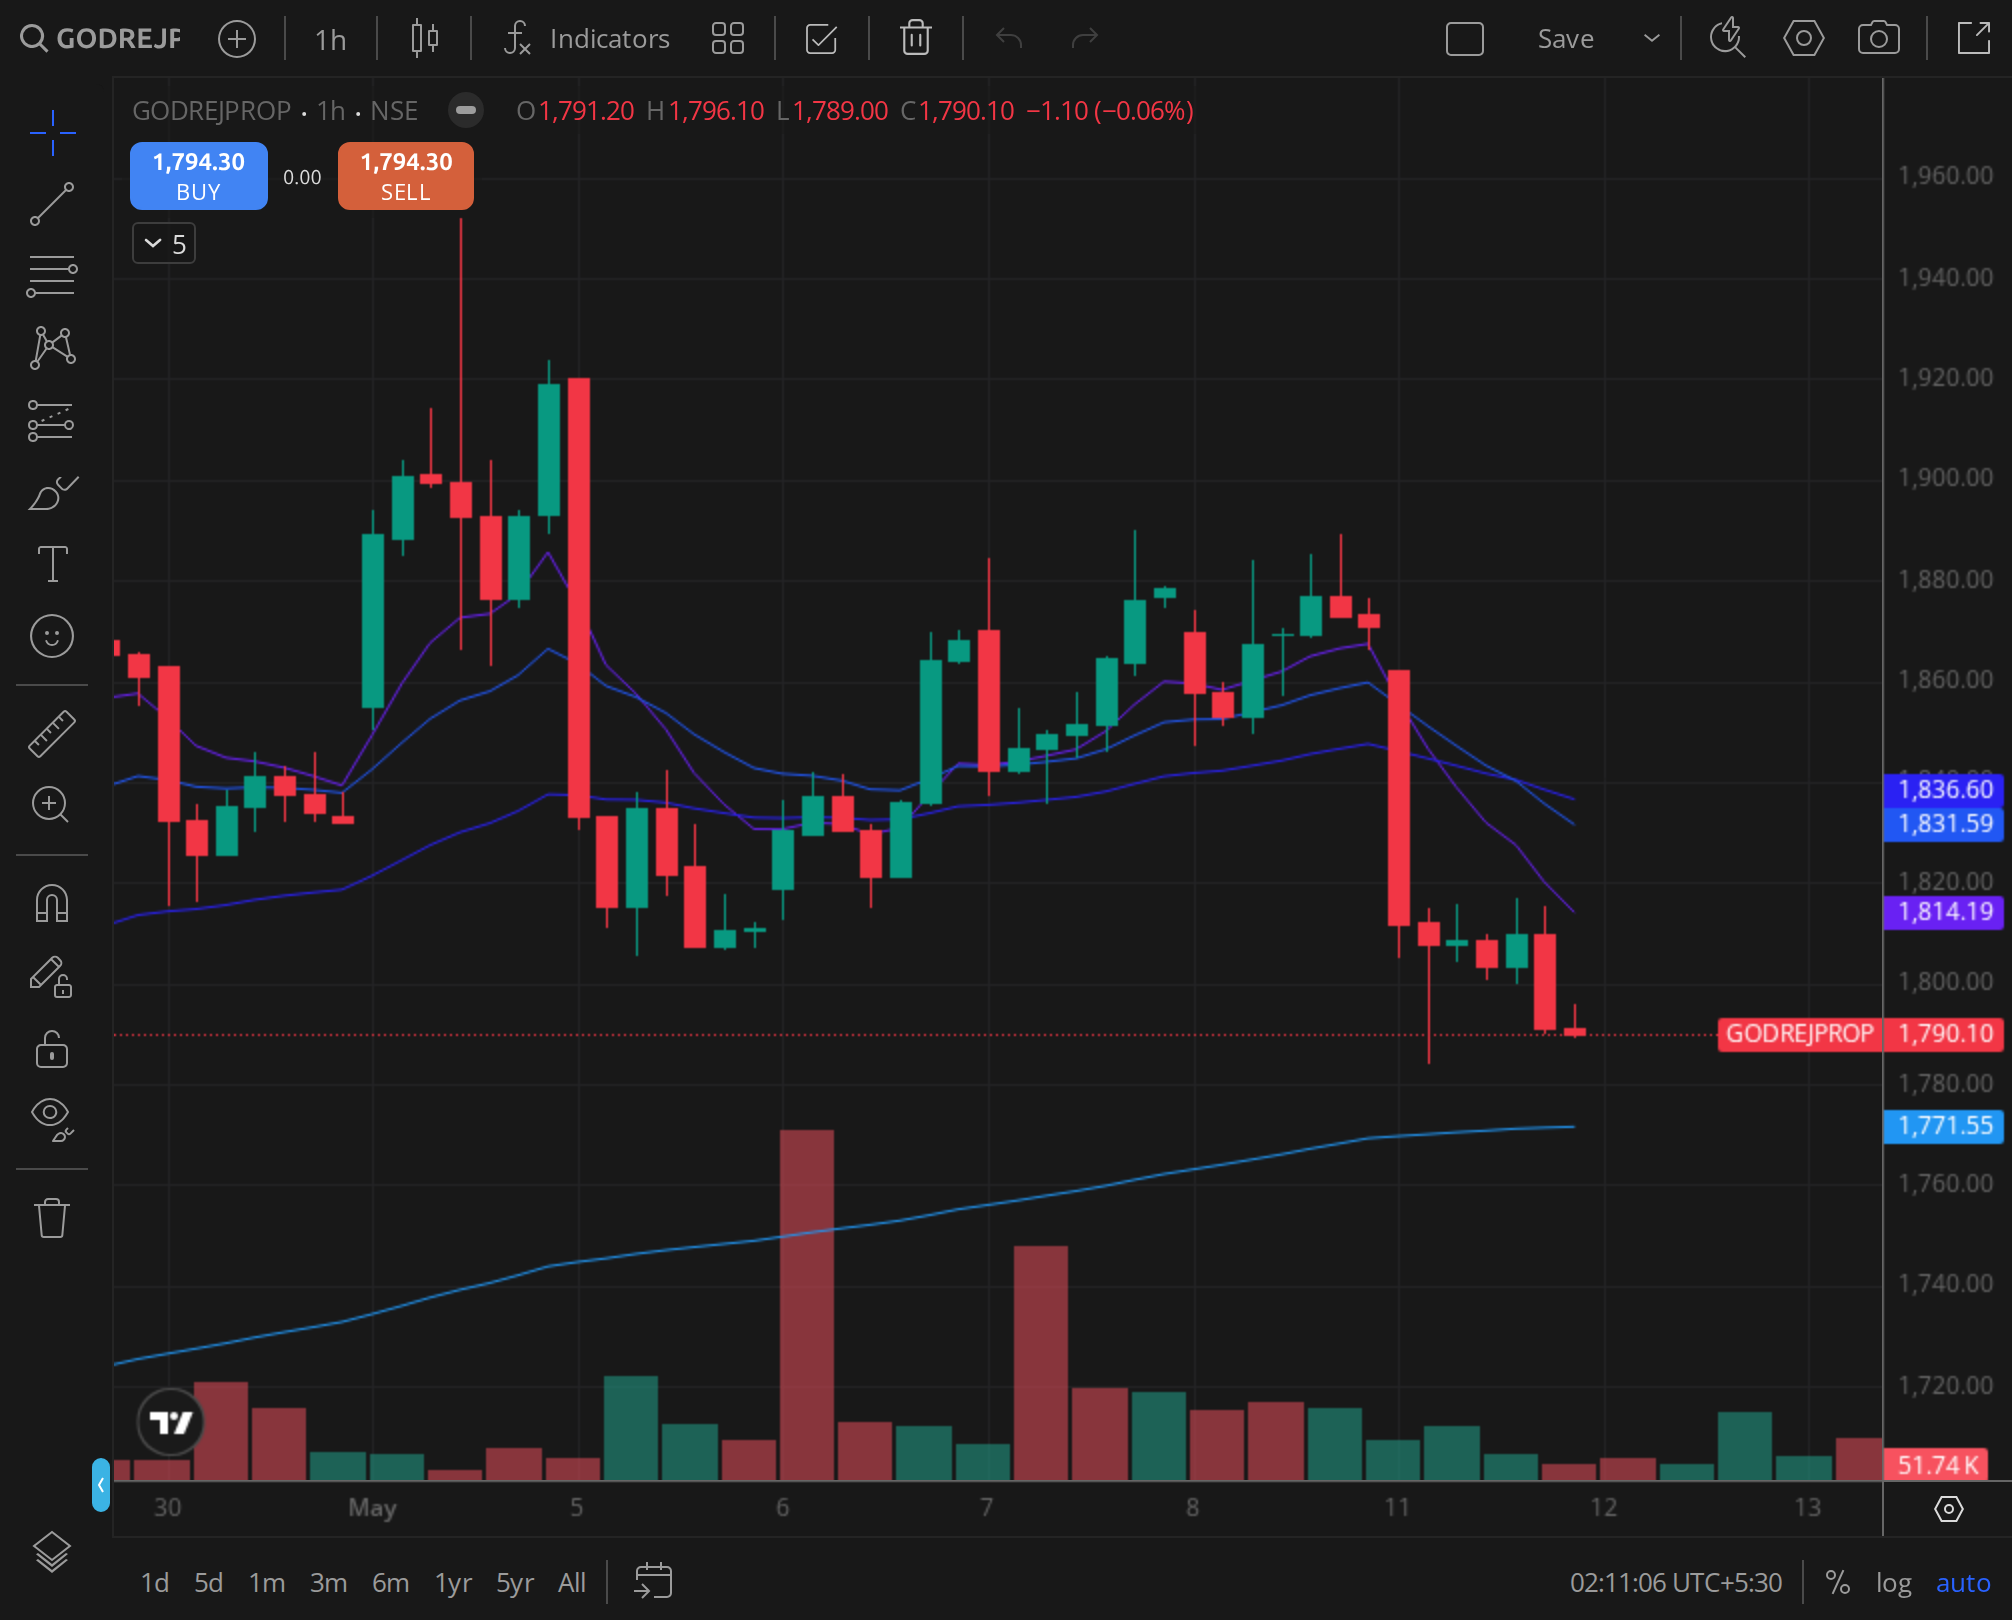
Caption: GODREJPROP 30min timeframe around 2024-11-05.
By the time Godrej Properties printed ₹2,934 on the NSE close of November 5, 2024, the stock had quietly travelled almost 18 percent off its September 21 intraday floor of ₹2,485. That is not a small move for a Nifty Realty heavyweight that, only weeks earlier, had been treated by the tape as a tired post-rally hangover. The interesting part was not the magnitude. It was the texture. Six weeks of patient base-building, an October that refused to break down despite a heavy festive distribution overhang, and then a clean push through the 50-day moving average in the very first week of November. That sequence, viewed told a tighter story than the headlines did at the time.
I want to walk through the move the way a position trader would have read it on the morning of November 6, 2024, with the close in hand and Q2 commentary on the desk, before the realty index gave back part of the rally into mid-November.
The weekly structure: a base, not a top
The weekly chart was, in hindsight, the cleanest piece of evidence that the September swoon was a correction inside an uptrend, not the first leg of distribution.
The two-year weekly view, drawn from November 2022 onward, framed the September 2024 dip as the second meaningful pullback inside a multi-quarter uptrend. The stock had compounded sharply through 2023 and into the first half of 2024 on the back of strong pre-sales prints and a broader rerating of organised residential developers. The August 2024 high in the realty index marked the obvious distribution candidate, and Godrej Properties did mark a lower high into September. But the September floor near ₹2,485 held against the April 2024 reaction zone, which is the kind of higher-low geometry that swing-traders pay actual money to wait for.
What mattered on the weekly was the absence of a clean breakdown candle. There was no marubozu red weekly print with expanding range below the prior swing. Instead, the September low was rejected the same week, and October printed three indecisive weekly candles inside the prior week's range. By the time the November 4 weekly bar closed, the stock had recaptured both its 10-week and 20-week averages in the same session, and the weekly volume profile (per NSE bhavcopy aggregates) had moved meaningfully above the trailing eight-week mean. A weekly base that ends with a high-volume close above two short-term means is not a coincidence. It is positioning.
Daily tape: the 50-DMA reclaim that actually held
Where the weekly told you the trend was alive, the daily told you when it switched on.
Through October, the daily structure was a textbook flat-to-slightly-up consolidation. Lower wicks on most weak sessions, very few closes below the prior day's low, and a clear refusal to revisit the ₹2,485 print. The 50-day moving average, which had acted as resistance through the entire October base, sat in the ₹2,830 to ₹2,860 zone depending on the day's recalculation. The stock probed it twice in late October, failed both times intraday, and pulled back into the base without conviction selling.
The November 4 session changed the read. Volume on that Monday, again per NSE bhavcopy, was visibly heavier than the October daily mean, and the close was above the 50-DMA for the first time in more than six weeks. The follow-through on November 5 was the more important tell. A reclaim that gets sold the next day is a fakeout. A reclaim that prints a higher high and a higher close, on volume that does not fade, is a trend resumption. November 5 delivered the second pattern. The ₹2,934 close was both a higher high versus the late-October swing and a clean expansion candle off the 50-DMA, which had now flipped from resistance into support.
For anyone running a simple trend-following daily system on this name, the signal fired on November 4 and was confirmed on November 5. There was no ambiguity in the daily MA stack by the close of that Tuesday.
The intraday signature on November 5
The thirty-minute tape from October 31 through November 5 was the granular evidence that institutions, not retail, were doing the heavier lifting on the breakout day.
Three things stood out on the intraday view.
First, the October 31 to November 1 window, which sat across the Muhurat session and the Diwali break, was unusually orderly. There was no panic distribution into the long weekend, which is the move you would expect if institutional holders were trimming ahead of festive illiquidity. The range was narrow and the closes were clustered. That kind of pre-event calm in a high-beta realty name is itself information.
Second, the November 4 session built its gains steadily through the day rather than spiking on the open. That is the pattern you see when a fund is accumulating against a tape rather than chasing a gap. The close was near the day's high, but the path was a slow grind, not a momentum burst.
Third, and most telling, November 5 opened firm, ran almost the entire day's range in the first three half-hour bars, and then held the breakout level for the rest of the session. Strong opens that hold are a different animal from strong opens that fade. The thirty-minute volume signature on the breakout bar was, by inspection, the heaviest of the five-day window. That is the textbook footprint of a continuation gap turning into a trend day.
The fundamental case that supported the tape
Price action rarely runs alone for long. The November move had a fundamental scaffold underneath it.
Godrej Properties had, going into Diwali 2024, been one of the strongest pre-sales performers in the listed organised developer pack. The Q2 FY25 update, in line with the company's pattern over the prior several quarters, flagged continued strength in bookings across the Mumbai Metropolitan Region, the National Capital Region, and Bengaluru. Pre-sales, not reported revenue, had been the metric that the buy-side had been underwriting the stock on for almost two years, because of the well-understood lag between booking and revenue recognition under Ind AS 115 for real-estate developers. As long as pre-sales kept compounding, the rerating thesis stayed intact.
The sector context helped. Through October and into early November 2024, the Nifty Realty index quietly outperformed the broader Nifty 50, supported by the same set of factors that had driven the multi-quarter realty story: consolidation toward branded developers post-RERA, healthy festive demand in the premium and luxury segments, and a sustained absorption rate in the top seven cities that had kept inventory overhang in check. The festive launch calendar across the listed names had been heavy, and management commentary across the peer set had stayed constructive on demand. Godrej Properties was not running alone. It was running with its sector, which is a far more durable kind of strength than a single-stock squeeze.
Peer comparison reinforced the picture. The other large-cap organised developers, on the same window, were either making fresh swing highs or retesting their August levels. The relative-strength read on Godrej Properties versus the realty index was not exceptional, but it was clean. The stock was carrying its weight, not laggard, not leader.
Sentiment, derivatives and the brokerage tape
The F&O snapshot around November 5, 2024 was consistent with a constructive but not euphoric setup. Open interest in the November series had built progressively through the second half of October, and the put-call structure on the strike map showed call writing thinning at the at-the-money level into the breakout, with put writers active at strikes below the spot zone. That is the kind of options positioning that supports a breakout rather than caps it, because the path of least resistance for dealer hedging flows is to chase price higher into a thinning call wall.
The FII derivative posture across the broader index, on the same dates, had been net constructive after the late-September drawdown, and stock-specific FII activity in the cash segment on Godrej Properties, while not extreme, did not show signs of distribution into the rally. The brokerage tape through October and into early November carried a mix of target-price upgrades on the back of the Q2 pre-sales print, with most of the major domestic and a couple of foreign houses retaining buy or accumulate ratings. There were no headline downgrades into the breakout, which mattered, because a single high-profile downgrade often becomes the excuse for momentum funds to take profit.
The sentiment stack was not flashing greed. It was flashing constructive positioning, which is the more useful condition for a trend continuation.
A historical analog worth flagging
Godrej Properties had, in the prior eighteen months, given two comparable setups: a similar higher-low base in late 2023 ahead of its early-2024 leg, and a tighter consolidation in mid-2023 that resolved upward. In both prior cases, the 50-DMA reclaim on volume marked the start of a multi-week trend, not a one-week pop. The November 2024 setup rhymed with the late-2023 instance more than the mid-2023 one, in the sense that it followed a meaningful drawdown rather than a shallow pause. The implication, ex-ante, was that the move had room to run beyond a single weekly bar. The implication, ex-post, was that traders who used the November 4 close as a trigger and the September 21 low as the invalidation got a clean asymmetric setup with a defined risk.
Was the move justified?
Yes, on the evidence available at the close of November 5, 2024. The fundamental scaffold (Q2 pre-sales, sector tailwind, peer confirmation) was intact. The technical structure (weekly higher low, daily 50-DMA reclaim, intraday volume signature) was clean. The sentiment stack (options flow, FII posture, brokerage tape) was constructive. The historical analog supported continuation rather than failure. The 5-day forward read, from the November 5 close, was that the stock had more upside to extract before any meaningful pullback, with the breakout level around ₹2,860 serving as the first support to defend.
What the chart could not have told you on that evening was the precise shape of the subsequent move into November 20, when the broader realty tape gave back part of the rally on profit-booking. But the trade was never about catching the absolute top. It was about being long the right name, in the right sector, on the right setup, with a defined invalidation. On those terms, the November 5 print was a textbook continuation entry, and the post-trade evidence supported the read.
Verdict
Stance: BULLISH (retrospective, as read on the close of November 5, 2024) Horizon: 1mo from the focus date Rationale: Weekly higher low, daily 50-DMA reclaim on heavy volume, Q2 pre-sales scaffold and a constructive realty tape combined into a clean continuation setup with defined risk at the September 21 low.
, Aditya Sharma