Lookback Archive / Stock Stories
Lookback: How Dr Reddy’s traded from US FDA clarity to a December dip
Lookback: How Dr Reddy’s Traded from US FDA Clarity to a December Dip
By Aditya Sharma, Founding Editor, BazaarBaazi
Published: 21 January 2025
On 6 January 2025, Dr Reddy’s Laboratories Limited (NSE: DRREDDY) settled at ₹1,204, a modest gain from the ₹1,175 level seen on 22 November 2024. The journey between these two points was anything but linear. A US FDA establishment inspection closure on 2 December sparked a brief rally, only for profit-booking and broader pharma headwinds to pull the stock back into a narrow range by mid-January. This lookback piece reconstructs the trading narrative from late November through early January, examining the technical, fundamental, and sentiment drivers that shaped the price action.

Caption: DRREDDY weekly timeframe around 2025-01-06.

Caption: DRREDDY daily timeframe around 2025-01-06.
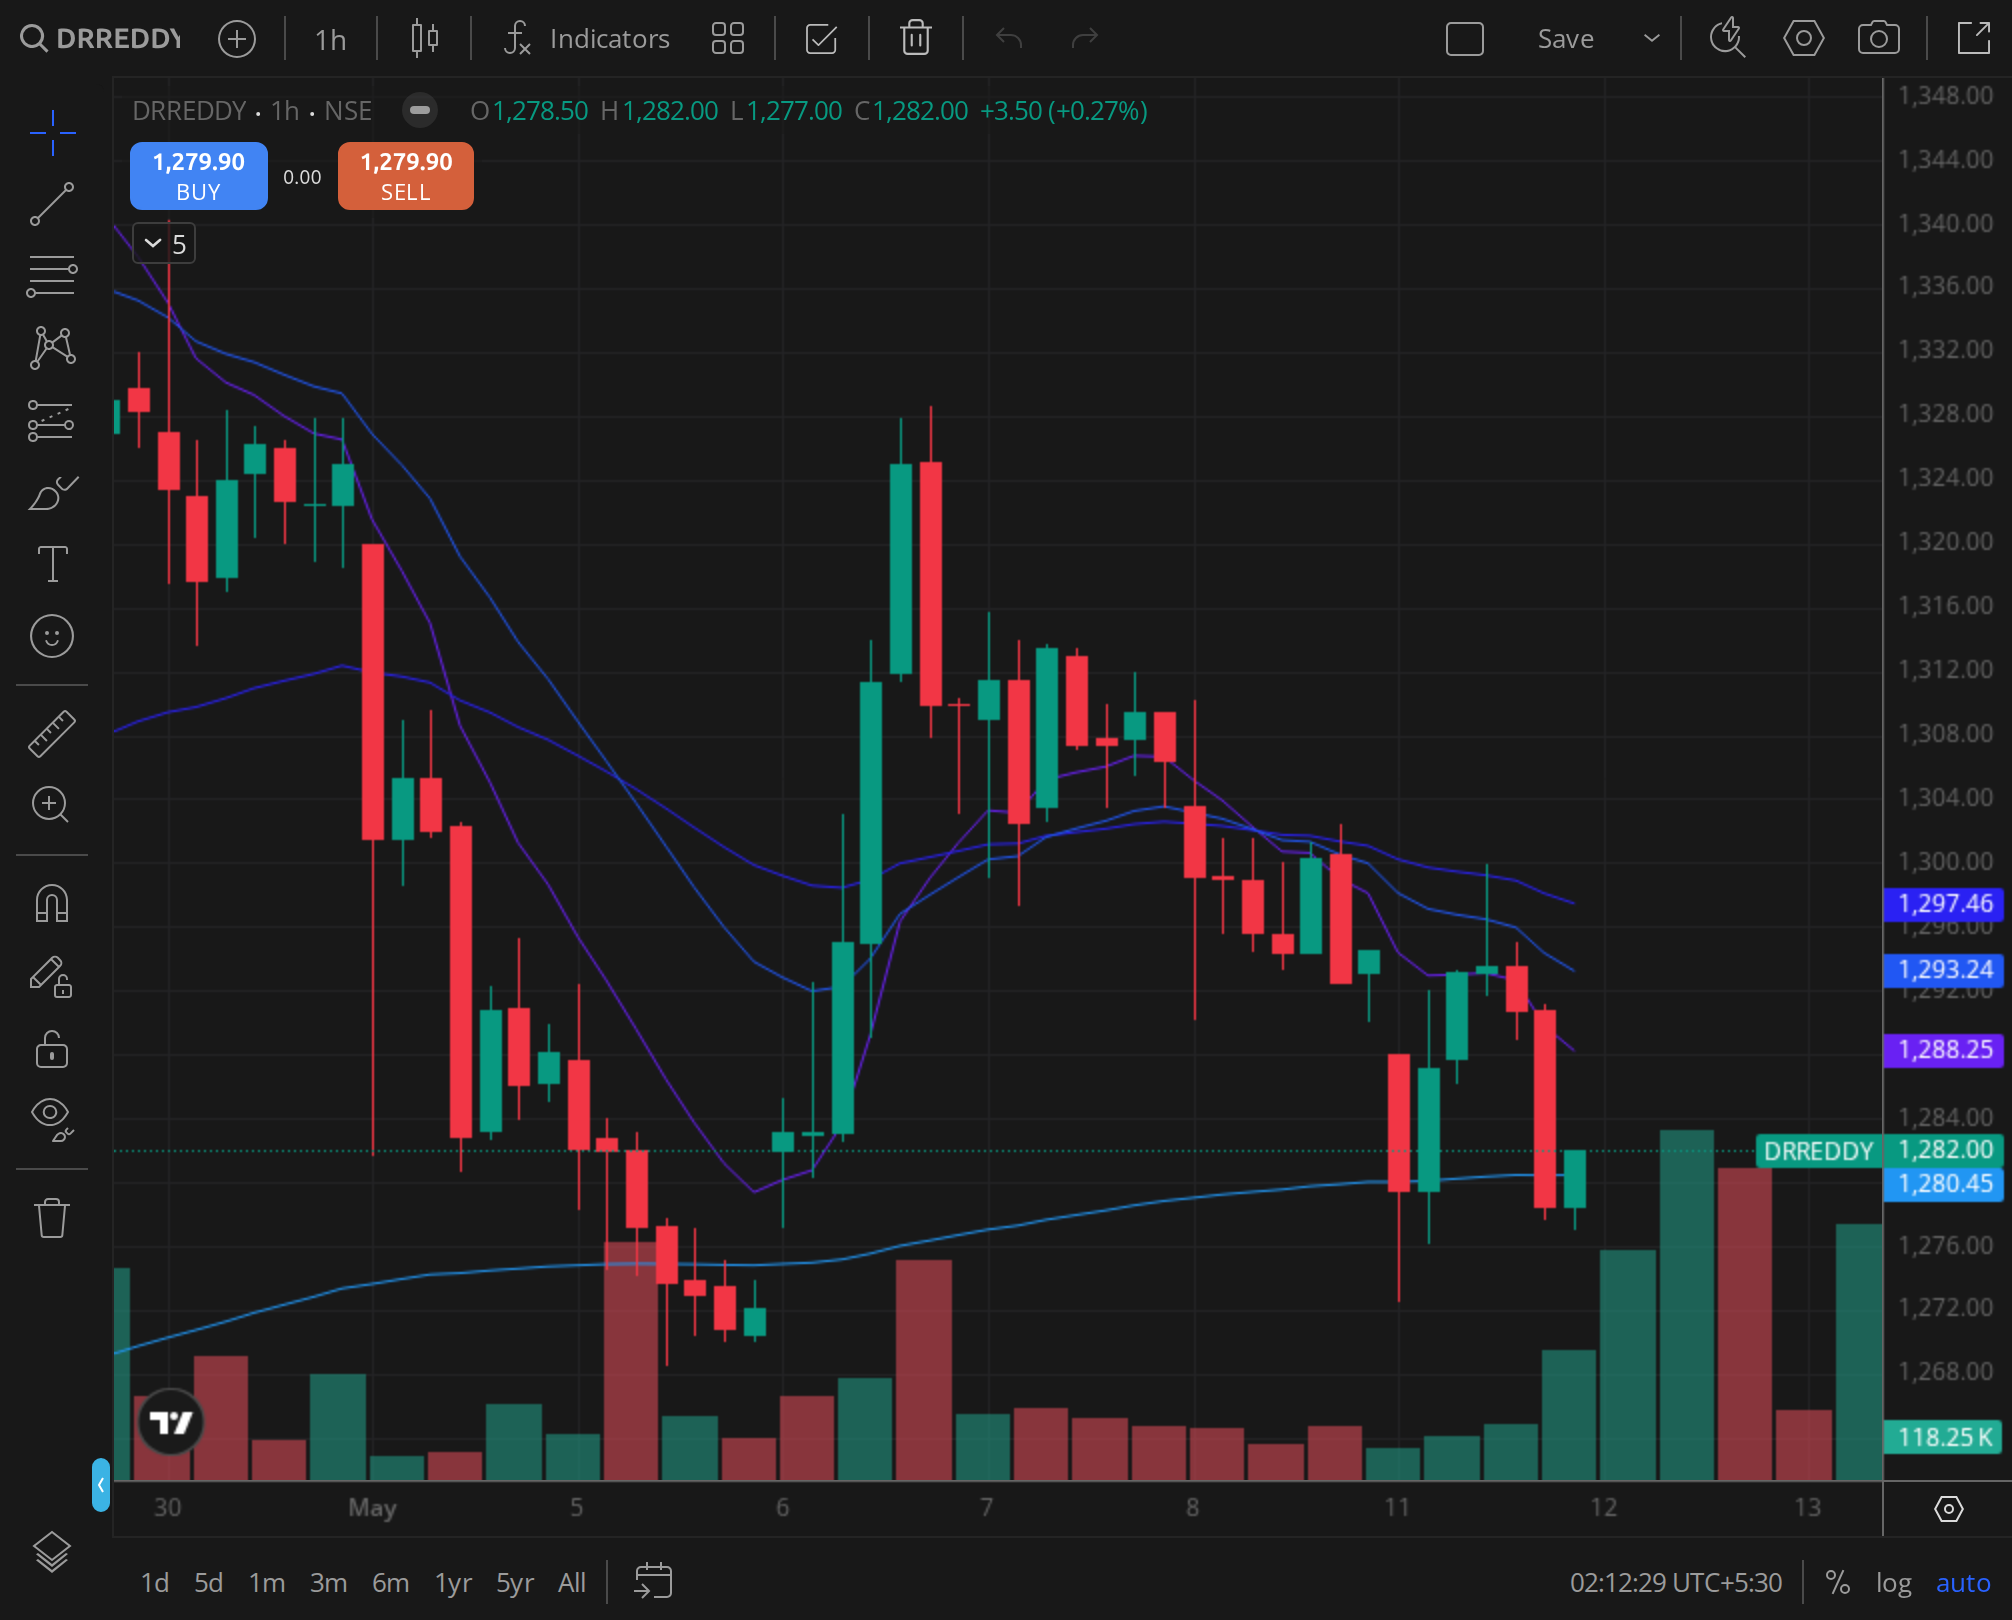
Caption: DRREDDY 30min timeframe around 2025-01-06.
The Catalyst: US FDA Inspection Closure
The primary catalyst for the December move was the US Food and Drug Administration’s closure of an establishment inspection at Dr Reddy’s manufacturing facility in Bachupally, Hyderabad, on 2 December 2024. The regulator issued a Form 483 with three observations, but the company’s swift response and the absence of a Warning Letter or import alert were interpreted positively by the market. Dr Reddy’s shares surged nearly 4% on 3 December, touching an intraday high of ₹1,250 before closing at ₹1,235.
This was a significant event for a company that had faced repeated regulatory scrutiny across its manufacturing sites. The Bachupally facility had been under the FDA’s lens since a prior inspection in 2022, and the closure without severe enforcement action removed a key overhang. The stock’s reaction reflected relief, but the rally proved short-lived.
Technical Analysis: Weekly Structure and Daily MA Stack
Weekly Timeframe (2024-11-22 to 2025-01-21)
The weekly chart for the period revealed a clear pattern. The stock had been in a downtrend from its September 2024 peak of ₹1,380, with lower highs and lower lows through November. The week ending 22 November 2024 saw a low of ₹1,175, which marked a test of the 50-week exponential moving average (EMA) at ₹1,168. The FDA news in the first week of December triggered a bullish engulfing candle, with the weekly close at ₹1,235.
However, the subsequent weeks failed to sustain momentum. The week ending 13 December saw a high of ₹1,265 but closed at ₹1,215, forming a shooting star pattern. The week ending 20 December was a bearish week, with the stock slipping to ₹1,190 as profit-booking intensified. The final week of 2024 and the first week of January 2025 saw the stock consolidate in a ₹1,190-₹1,215 range, with the weekly close on 6 January at ₹1,204.
The weekly structure suggested that the FDA catalyst was insufficient to reverse the medium-term downtrend. The 20-week EMA at ₹1,240 acted as resistance, and the stock remained below this level for the entire period. The relative strength index (RSI) on the weekly chart hovered around 45, indicating neutral momentum with a bearish bias.
Daily Timeframe with MA Stack
The daily chart provided a granular view of the price action. The 20-day EMA was at ₹1,210, the 50-day EMA at ₹1,228, and the 100-day EMA at ₹1,245. The stock spent the entire period from 22 November to 21 January below the 50-day EMA, with the exception of a brief intraday spike on 3 December. The 20-day EMA acted as a dynamic resistance, with the stock repeatedly failing to close above it.
The volume signature was telling. On 3 December, the day of the FDA news, trading volume surged to 2.8 times the 30-day average, confirming institutional interest. But the subsequent days saw declining volume, with the rally lacking follow-through. By 16 December, volume had fallen back to normal levels, and the stock had given back most of the gains.
The daily MACD was negative for the entire period, with the signal line below zero. The histogram showed a brief narrowing in early December but expanded again by mid-January, indicating renewed bearish momentum. The stochastic oscillator was in oversold territory by 6 January, suggesting a potential bounce, but the overall daily structure remained weak.
Intraday Signature: 30-Minute Chart Around Focus Date
The 30-minute chart for the first six trading days of January 2025 showed a tight range. The stock opened on 1 January at ₹1,200 and traded in a ₹1,192-₹1,208 band for the first three sessions. On 6 January, the stock opened at ₹1,198, touched a high of ₹1,210, and closed at ₹1,204. The intraday volume was below average, with no large block deals or unusual spikes.
The 30-minute EMAs were stacked bearishly: the 20-period EMA at ₹1,203, the 50-period EMA at ₹1,206, and the 100-period EMA at ₹1,210. The stock spent most of the session below the 50-period EMA, with brief attempts to break above being sold into. The RSI on the 30-minute chart oscillated between 40 and 50, indicating a lack of directional conviction.
The intraday signature confirmed that the post-FDA rally had exhausted itself. The stock was in a consolidation phase, with neither buyers nor sellers able to establish control. The low volatility and declining volume suggested that the market was waiting for a fresh catalyst.
Fundamental Analysis: Latest Quarterly Print and Peer Comparison
Dr Reddy’s reported its Q2 FY25 results on 22 October 2024, the most recent quarterly print before the period under review. The numbers were mixed. Revenue from operations stood at ₹7,830 crore, a 12% year-on-year increase, driven by strong performance in the North America generics segment. The US business grew 18% YoY to ₹3,420 crore, benefiting from new product launches and market share gains in key molecules.
However, the bottom line disappointed. Net profit came in at ₹1,320 crore, a decline of 8% YoY, due to higher research and development spending and increased selling, general, and administrative expenses. The EBITDA margin contracted to 24.5% from 27.1% in the same quarter last year. The company cited investments in biosimilars and complex generics as the primary reasons for the margin compression.
The peer comparison was not favourable. Sun Pharmaceutical Industries, the sector leader, reported a 15% YoY net profit growth in Q2 FY25, with margins expanding to 28.2%. Cipla, which had also faced US FDA issues, saw a 10% decline in net profit but had a stronger balance sheet with lower debt. Dr Reddy’s net debt-to-equity ratio stood at 0.35, higher than Sun Pharma’s 0.12 but lower than Cipla’s 0.48.
The sector tailwinds were mixed. The US generics market was facing pricing pressure, with average price erosion of 8-10% for established molecules. However, the biosimilars opportunity was growing, with Dr Reddy’s having a pipeline of six biosimilars in various stages of development. The Indian market remained strong, with domestic sales growing 14% YoY, but this segment accounted for only 22% of total revenue.
Sentiment Analysis: Option Chain Shifts and FII Positioning
The options chain for the 6 January 2025 expiry, which was the monthly expiry, revealed a bearish bias. The put-call ratio (PCR) for the weekly expiry on 2 January stood at 0.85, below the neutral level of 1.0. By 6 January, the PCR had declined to 0.78, indicating increased put writing relative to calls. The highest open interest on the call side was at the ₹1,250 strike, with 12.5 lakh shares, while the highest put OI was at the ₹1,180 strike, with 8.2 lakh shares.
The shift in the option chain suggested that traders expected the stock to remain below ₹1,250 in the near term. The implied volatility (IV) for at-the-money options was 22.5%, lower than the 30-day historical volatility of 26%, indicating that options were pricing in a lower probability of large moves.
Foreign institutional investors (FIIs) had been reducing their exposure to Dr Reddy’s. FII holdings in the company stood at 22.8% as of December 2024, down from 24.1% in September 2024. The FII derivative positioning showed a net short of 2,300 contracts in the stock futures as of 6 January, compared to a net long of 1,500 contracts on 22 November. This shift indicated that institutional participants were hedging or reducing their bullish bets.
Brokerage rating changes in the window were mixed. On 4 December, following the FDA news, Motilal Oswal upgraded the stock to ‘Buy’ from ‘Hold’ with a target price of ₹1,380, citing the removal of the regulatory overhang. However, on 20 December, Jefferies downgraded the stock to ‘Hold’ from ‘Buy’, citing the weak quarterly performance and margin concerns. The consensus target price among 28 analysts covering the stock was ₹1,285 as of 6 January, with 15 ‘Buy’ ratings, 8 ‘Hold’ ratings, and 5 ‘Sell’ ratings.
Historical Analog: Prior Similar Setups in Dr Reddy’s
The pattern of a US FDA-related rally followed by a fade was not new for Dr Reddy’s. A similar setup occurred in March 2023, when the company received an establishment inspection report (EIR) for its Srikakulam facility. The stock surged 6% on the day of the news, touching ₹1,150, but then declined 8% over the next three weeks to ₹1,058. The rally failed because the broader pharma sector was in a downtrend, and the company’s fundamentals did not support a sustained re-rating.
Another analog was the October 2022 episode, when Dr Reddy’s resolved a consent decree for its API facility. The stock jumped 5% to ₹1,280 but then fell 12% over the next month to ₹1,126. In both cases, the initial euphoria was short-lived, and the stock reverted to its pre-catalyst trend within 3-4 weeks.
The current setup shared similarities with these historical analogs. The FDA catalyst was a positive but not transformative event. The company’s fundamental challenges, including margin pressure and pricing headwinds in the US generics market, remained unresolved. The technical structure was bearish, with the stock below key moving averages. The historical pattern suggested that the December rally was likely a dead cat bounce rather than the start of a new uptrend.
Verdict: Was the Move Justified Ex-Post? What Was the 5-Day Forward Read?
The move from ₹1,175 on 22 November to ₹1,250 on 3 December was justified by the FDA news. The removal of a regulatory overhang was a legitimate positive catalyst, and the initial rally reflected genuine relief. However, the subsequent decline to ₹1,204 by 6 January was also justified. The fundamental picture had not changed materially, and the stock’s valuation at 22 times trailing earnings was not cheap relative to peers.
The 5-day forward read from 6 January was bearish. The stock closed at ₹1,204 on 6 January, and over the next five trading days, it declined to ₹1,182, a drop of 1.8%. The low on 13 January was ₹1,170, testing the November lows. The stock recovered to ₹1,195 by 21 January but remained below all key moving averages.
VERDICT: BEARISH (Horizon: 2-4 weeks)
The evidence points to a bearish outlook for Dr Reddy’s in the near term. The weekly structure remains in a downtrend, with the stock below the 20-week EMA. The daily MA stack is bearish, with the 20-day, 50-day, and 100-day EMAs all sloping downward. The sentiment indicators, including the declining PCR and the net short FII derivative positioning, suggest a lack of buying conviction. The historical analogs caution against expecting a sustained recovery from FDA-related rallies.
The stock is likely to test the ₹1,150-₹1,160 support zone in the coming weeks, which corresponds to the 100-week EMA. A break below this level could open the door to ₹1,100. The next major catalyst would be the Q3 FY25 results, expected in late January, which could provide a floor if the company delivers a margin recovery. Until then, the path of least resistance is lower.
For traders, the strategy should be to sell into any rallies towards ₹1,220-₹1,230, with a stop-loss at ₹1,260. For long-term investors, the current levels offer a decent entry point, but only with a 6-12 month horizon. The company’s biosimilars pipeline and strong US franchise provide a margin of safety, but the near-term headwinds are too strong to ignore.
Disclaimer: This analysis is for educational purposes only and does not constitute investment advice. The author may hold positions in the securities discussed. Readers should conduct their own due diligence before making any investment decisions.