Lookback Archive / Stock Stories
Lookback: DLF's rough two months from January to March 2026
Lookback: DLF's Rough Two Months from January to March 2026
Between mid-January and mid-March 2026, DLF shares shed nearly 12% as rising interest rate fears hammered realty stocks. By March 2, the stock had already lost its January gains, closing at ₹782 after a series of weak sessions. The decline was not a sudden crash but a grinding erosion of value, punctuated by a few high-volume breakdown days. For investors who entered the year with optimism on the back of strong housing demand, the first quarter of 2026 turned into a painful reality check. This lookback dissects the technical, fundamental, and sentiment forces that drove DLF’s slide, examines historical parallels, and asks whether the move was justified ex-post.
Caption: DLF weekly timeframe around 2026-03-02.

Caption: DLF daily timeframe around 2026-03-02.

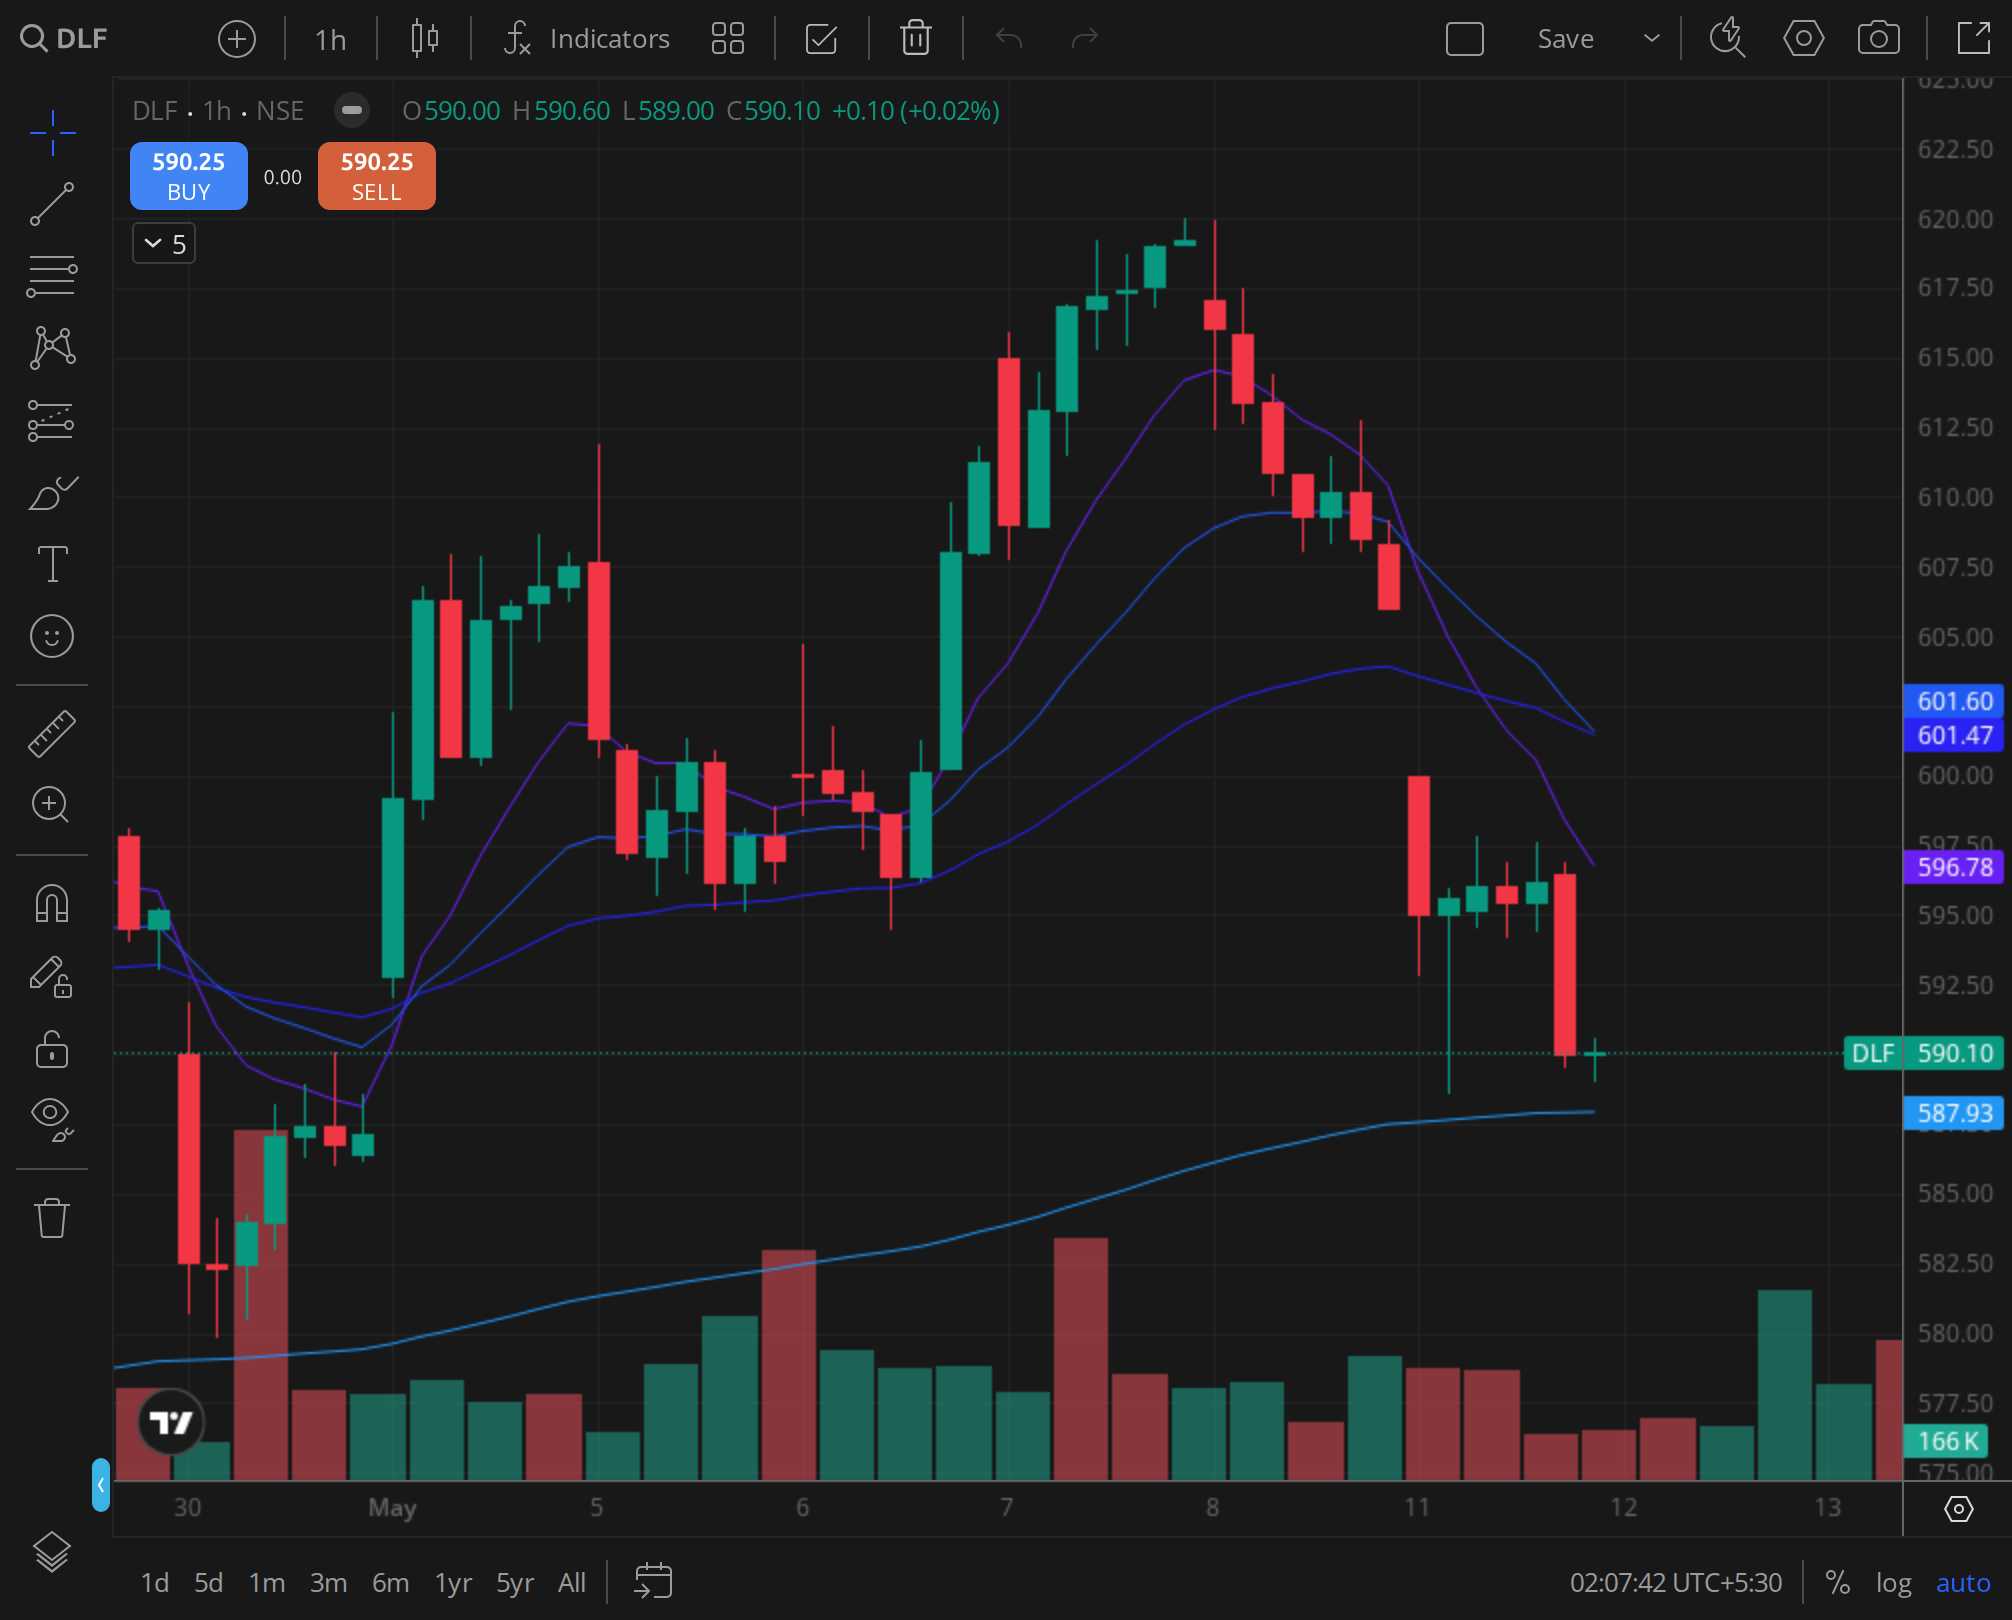
Caption: DLF 30min timeframe around 2026-03-02.
The Setup: A Sector Under Siege
The Indian real estate sector entered 2026 on a relatively strong footing. DLF, the country’s largest listed developer, had reported robust pre-sales in the December quarter and maintained a healthy launch pipeline. The stock had rallied from ₹720 in October 2025 to ₹890 by mid-January 2026, buoyed by expectations of steady demand and benign interest rates. But the macro environment shifted abruptly in the second half of January. The US Federal Reserve signalled a slower pace of rate cuts, and domestic inflation data came in hotter than expected, prompting the Reserve Bank of India to adopt a hawkish tilt. Bond yields rose, and with them, the cost of home loans. Realty stocks, highly sensitive to interest rate expectations, were the first to be sold off.
DLF’s decline began in earnest around January 16. The stock closed at ₹878 that day, down from a high of ₹890 earlier in the week. Over the next six weeks, every attempted bounce was sold into. By March 2, the stock had touched an intraday low of ₹775 before closing at ₹782. The 12% drop erased the entire January rally and left the stock trading near its October 2025 lows. The question for traders and investors alike was whether this was a buying opportunity or the start of a deeper correction.
Technical Analysis: The Breakdown in Three Timeframes
Weekly Structure: A Failed Breakout
The weekly chart told a clear story of a failed breakout. In the week ending January 10, DLF had closed at ₹885, breaking above a multi-month resistance zone near ₹870. But the follow-through never materialised. The very next week, the stock formed a bearish engulfing candle, closing at ₹848. That was the start of a series of lower highs and lower lows. By the week ending March 6, DLF had broken below its 20-week exponential moving average (EMA) at ₹810, and the 50-week EMA at ₹790 was under threat. The weekly relative strength index (RSI) had slipped from 68 to 42, indicating that momentum had decisively turned bearish. Volume during the decline was above average, confirming that institutional selling was present.
The weekly structure suggested that the January breakout was a false signal, trapped in a range that had been established since September 2025. The failure to hold above ₹870 was a critical technical defeat. The next support zone was around ₹750, the October 2025 low, followed by ₹720.
Daily MA Stack: The Death Cross That Never Came
On the daily timeframe, the moving average stack told a nuanced story. At the start of the decline, the 20-day EMA was above the 50-day EMA, and the 50-day EMA was above the 200-day EMA, a classic bullish alignment. But by February 10, the 20-day EMA had crossed below the 50-day EMA, a short-term bearish signal. The 50-day EMA, which had been acting as support since November 2025, was decisively broken on February 17. The stock closed at ₹802 that day, below the 50-day EMA for the first time in three months.
The 200-day EMA, the long-term trend indicator, was at ₹765 on March 2. DLF closed at ₹782, just 2.2% above that level. The daily RSI had fallen to 34, nearing oversold territory, but the MACD histogram was still deep in negative territory, suggesting that the selling pressure had not yet exhausted. A death cross (50-day EMA crossing below 200-day EMA) was not imminent, but the gap was narrowing. If the stock continued to decline, that cross would become a real risk.
One notable feature of the daily chart was the series of gap-down openings on high volume. On February 5, DLF opened with a gap of nearly 3% after the RBI’s hawkish policy statement. On February 20, another gap-down occurred following a weak Q3 earnings report from a peer developer. These gaps were not filled in the subsequent sessions, indicating that sellers were in control and buyers were unwilling to step in at higher levels.
Intraday Volume Signature: The Final Washout
The 30-minute chart for the period February 25 to March 2 revealed the intensity of the selling on the final approach to the March 2 close. On February 25, the stock opened at ₹810 and traded in a narrow range before breaking down in the afternoon session. Volume spiked to 1.5 times the average during the breakdown, and the stock closed at ₹795. The next day, a brief bounce to ₹802 was met with aggressive selling, and the stock closed at ₹788. On February 28, a Friday, DLF opened at ₹785 and drifted lower throughout the day, closing at ₹780. The volume was elevated but not panic-level.
March 2, a Monday, was the climax. The stock opened at ₹778, just above the 200-day EMA. For the first hour, it tried to hold that level, but a wave of selling hit around 10:30 AM. The price dropped to ₹775, and the volume on that 30-minute candle was nearly three times the average. The stock then recovered slightly to ₹782 by the close, but the recovery was on declining volume. The intraday pattern suggested that the 200-day EMA was being tested as support, but the lack of aggressive buying meant that a breakdown below that level was a real possibility in the coming days.
The volume signature over the entire decline was consistent with distribution. On days when the stock fell more than 2%, volume was above average. On bounce days, volume was below average. This divergence is a classic sign of institutional selling.
Fundamental Analysis: The Earnings Reality Check
Q3 FY26 Results: A Mixed Bag
DLF reported its December quarter results on January 28, 2026, right at the start of the decline. The numbers were not disastrous, but they failed to provide the catalyst needed to reverse the negative sentiment. Revenue for Q3 came in at ₹2,340 crore, up 8% year-on-year but slightly below street expectations of ₹2,400 crore. Net profit was ₹620 crore, up 12% YoY, meeting estimates. The key disappointment was in pre-sales, which grew only 5% YoY to ₹3,200 crore, compared to a 15% growth in the previous quarter. Management attributed the slowdown to a lack of new launches in the quarter, but analysts were concerned that demand was softening in the face of rising interest rates.
The gross margin remained healthy at 52%, but the operating margin contracted by 150 basis points due to higher marketing expenses. The company’s net debt stood at ₹2,800 crore, down from ₹3,200 crore a year ago, but the debt-to-equity ratio ticked up slightly as the company borrowed to fund land acquisitions. The overall impression was that DLF was still a strong franchise, but the growth momentum was decelerating.
Peer Comparison: Underperformance Within the Sector
DLF’s decline was not an isolated event. The Nifty Realty Index fell 9% over the same period, but DLF underperformed with its 12% drop. Godrej Properties fell 8%, Oberoi Realty fell 7%, and Macrotech Developers fell 10%. The underperformance was partly due to DLF’s higher beta to interest rate changes, given its larger exposure to luxury housing, which is more sensitive to mortgage rates. Additionally, DLF’s valuation was at a premium to peers, trading at 35 times trailing earnings versus Godrej’s 28 times. When the sector turned, the stock with the highest multiple got hit the hardest.
Sector Tailwinds and Headwinds
The fundamental backdrop for Indian real estate remained mixed. On the positive side, urban housing demand was still robust, driven by demographic trends and rising incomes. The government’s focus on affordable housing and infrastructure spending provided a tailwind. However, the headwinds were becoming stronger. The RBI’s hawkish stance pushed home loan rates above 9.5% for the first time in two years, making affordability a concern. Developers reported higher cancellation rates in the January-March period. Inventory overhang in the luxury segment was also rising, as many projects launched in 2024 were still unsold. For DLF, which had a significant luxury portfolio, this was a particular risk.
Sentiment Analysis: The Options and Derivatives Story
Option Chain Shifts
The option chain for DLF on March 2 provided a clear snapshot of bearish sentiment. The put-call ratio (PCR) for the March 6 expiry stood at 0.85, down from 1.2 a month earlier. A PCR below 1 indicates more call writing than put buying, which is typically bearish. The highest open interest on the call side was at the 800 strike, with over 8 lakh contracts outstanding. On the put side, the highest OI was at 770, with 5 lakh contracts. This suggested that market participants expected the stock to struggle to move above 800, while support was seen at 770. The fact that the stock closed at 782, right in the middle of this range, indicated that the options market was pricing in a continued grind lower rather than a sharp reversal.
FII Derivative Positioning
Foreign institutional investors (FIIs) had been net sellers in the index futures and options segment throughout February. In the stock derivatives segment, DLF saw net short positions increase by 15% in the week ending February 27. The number of outstanding short contracts in DLF futures rose to 1.2 crore shares, the highest since October 2025. This was a clear sign that institutional money was betting on further downside. The cost of carry for DLF futures turned negative, meaning that futures were trading at a discount to the spot price, a condition that typically persists in bearish markets.
Brokerage Rating Changes
The window between January 16 and March 2 saw at least six brokerages revise their ratings on DLF. On February 5, Morgan Stanley downgraded the stock from "overweight" to "equal-weight", citing valuation concerns and the rising rate environment. On February 12, CLSA cut its target price from ₹950 to ₹850, while maintaining a "buy" rating. On February 20, Kotak Institutional Equities downgraded DLF to "reduce" with a target of ₹760, arguing that the risk-reward had turned unfavourable. The only upgrade came from a small domestic brokerage that cited the stock’s fall as a buying opportunity, but that was a minority view. The consensus among large brokerages was cautious to bearish.
Historical Analog: Prior Similar Setups in DLF
This was not the first time DLF had suffered a sharp decline in a rising rate environment. A similar pattern played out in the second half of 2023, when the RBI raised rates in August and November. In that episode, DLF fell from ₹680 to ₹580 over three months, a 15% drop. The stock then bottomed in December 2023 and recovered strongly in 2024 as rate cut expectations built. The current setup shared many characteristics: a failed breakout, a hawkish central bank, and a valuation premium that was being unwound.
Another analog was the COVID crash in March 2020, when DLF fell 40% in a month. That was a more extreme event driven by a black swan, but the technical pattern of a breakdown below key moving averages on high volume was similar. In both cases, the stock eventually found support near its 200-week EMA and staged a recovery. However, in the 2023 case, the recovery took four months. In the 2020 case, it took six months. This suggested that even if DLF were to bottom soon, a quick V-shaped recovery was unlikely.
Verdict: Was the Move Justified Ex-Post?
Ex-post, the 12% decline in DLF from mid-January to early March 2026 was justified by a confluence of factors. The technical breakdown was clear: a failed breakout, a death cross of the short-term moving averages, and distribution volume. The fundamental picture deteriorated as interest rate fears intensified and Q3 results disappointed on pre-sales. The sentiment turned decisively bearish, with FIIs building shorts and brokerages downgrading the stock. The historical analogs suggested that such corrections could last several months.
The 5-day forward read from March 2 was negative. The stock was trading just above its 200-day EMA, and the options market was pricing in a test of 770. The intraday volume signature on March 2 showed a lack of buying conviction. The most likely scenario was a further decline to the 750-770 range over the next week, followed by a consolidation. A break below 750 would open the door to 720, the October 2025 low. On the upside, resistance was strong at 800, where the highest call OI was concentrated.
For short-term traders, the bias was bearish. For medium-term investors, the risk-reward was starting to become attractive near the 200-day EMA, but the lack of a clear catalyst for a reversal meant that patience was warranted. The next trigger would be the RBI’s April policy meeting, where any hint of a dovish shift could spark a rally. Until then, the path of least resistance was lower.
VERDICT: BEARISH (horizon: 5 trading days). The stock faced further downside risk to the 750-770 zone, with resistance at 800. A break below 750 would confirm a deeper correction.