Lookback Archive / Stock Stories
Lookback: How Bharti Airtel traded through tariff turbulence in early 2025
The telco that turned a tariff-deferral scare into a base, and what the April print told us about how the market was pricing pricing power.
By the time Bharti Airtel closed at ₹1,674.35 on April 11, 2025, the stock had already done the hard work. The two months prior had been a stress test of the bull thesis, a stretch in which the same hands that owned it from ₹1,200 in 2023 were asked to sit through a sharp drawdown built on a single, simple worry. If the December 2024 tariff hike had been the last for a while, then how exactly was the market supposed to underwrite the consensus model that needed another round in 2025? That question hung over the tape from the final week of February right into the April expiry, and the way Airtel handled it said a lot about how Indian large-cap telecom was being repriced from a growth-with-deleveraging story to a slower, steadier yield-and-cash-flow one.

Caption: BHARTIARTL weekly timeframe around 2025-04-11.
Caption: BHARTIARTL daily timeframe around 2025-04-11.

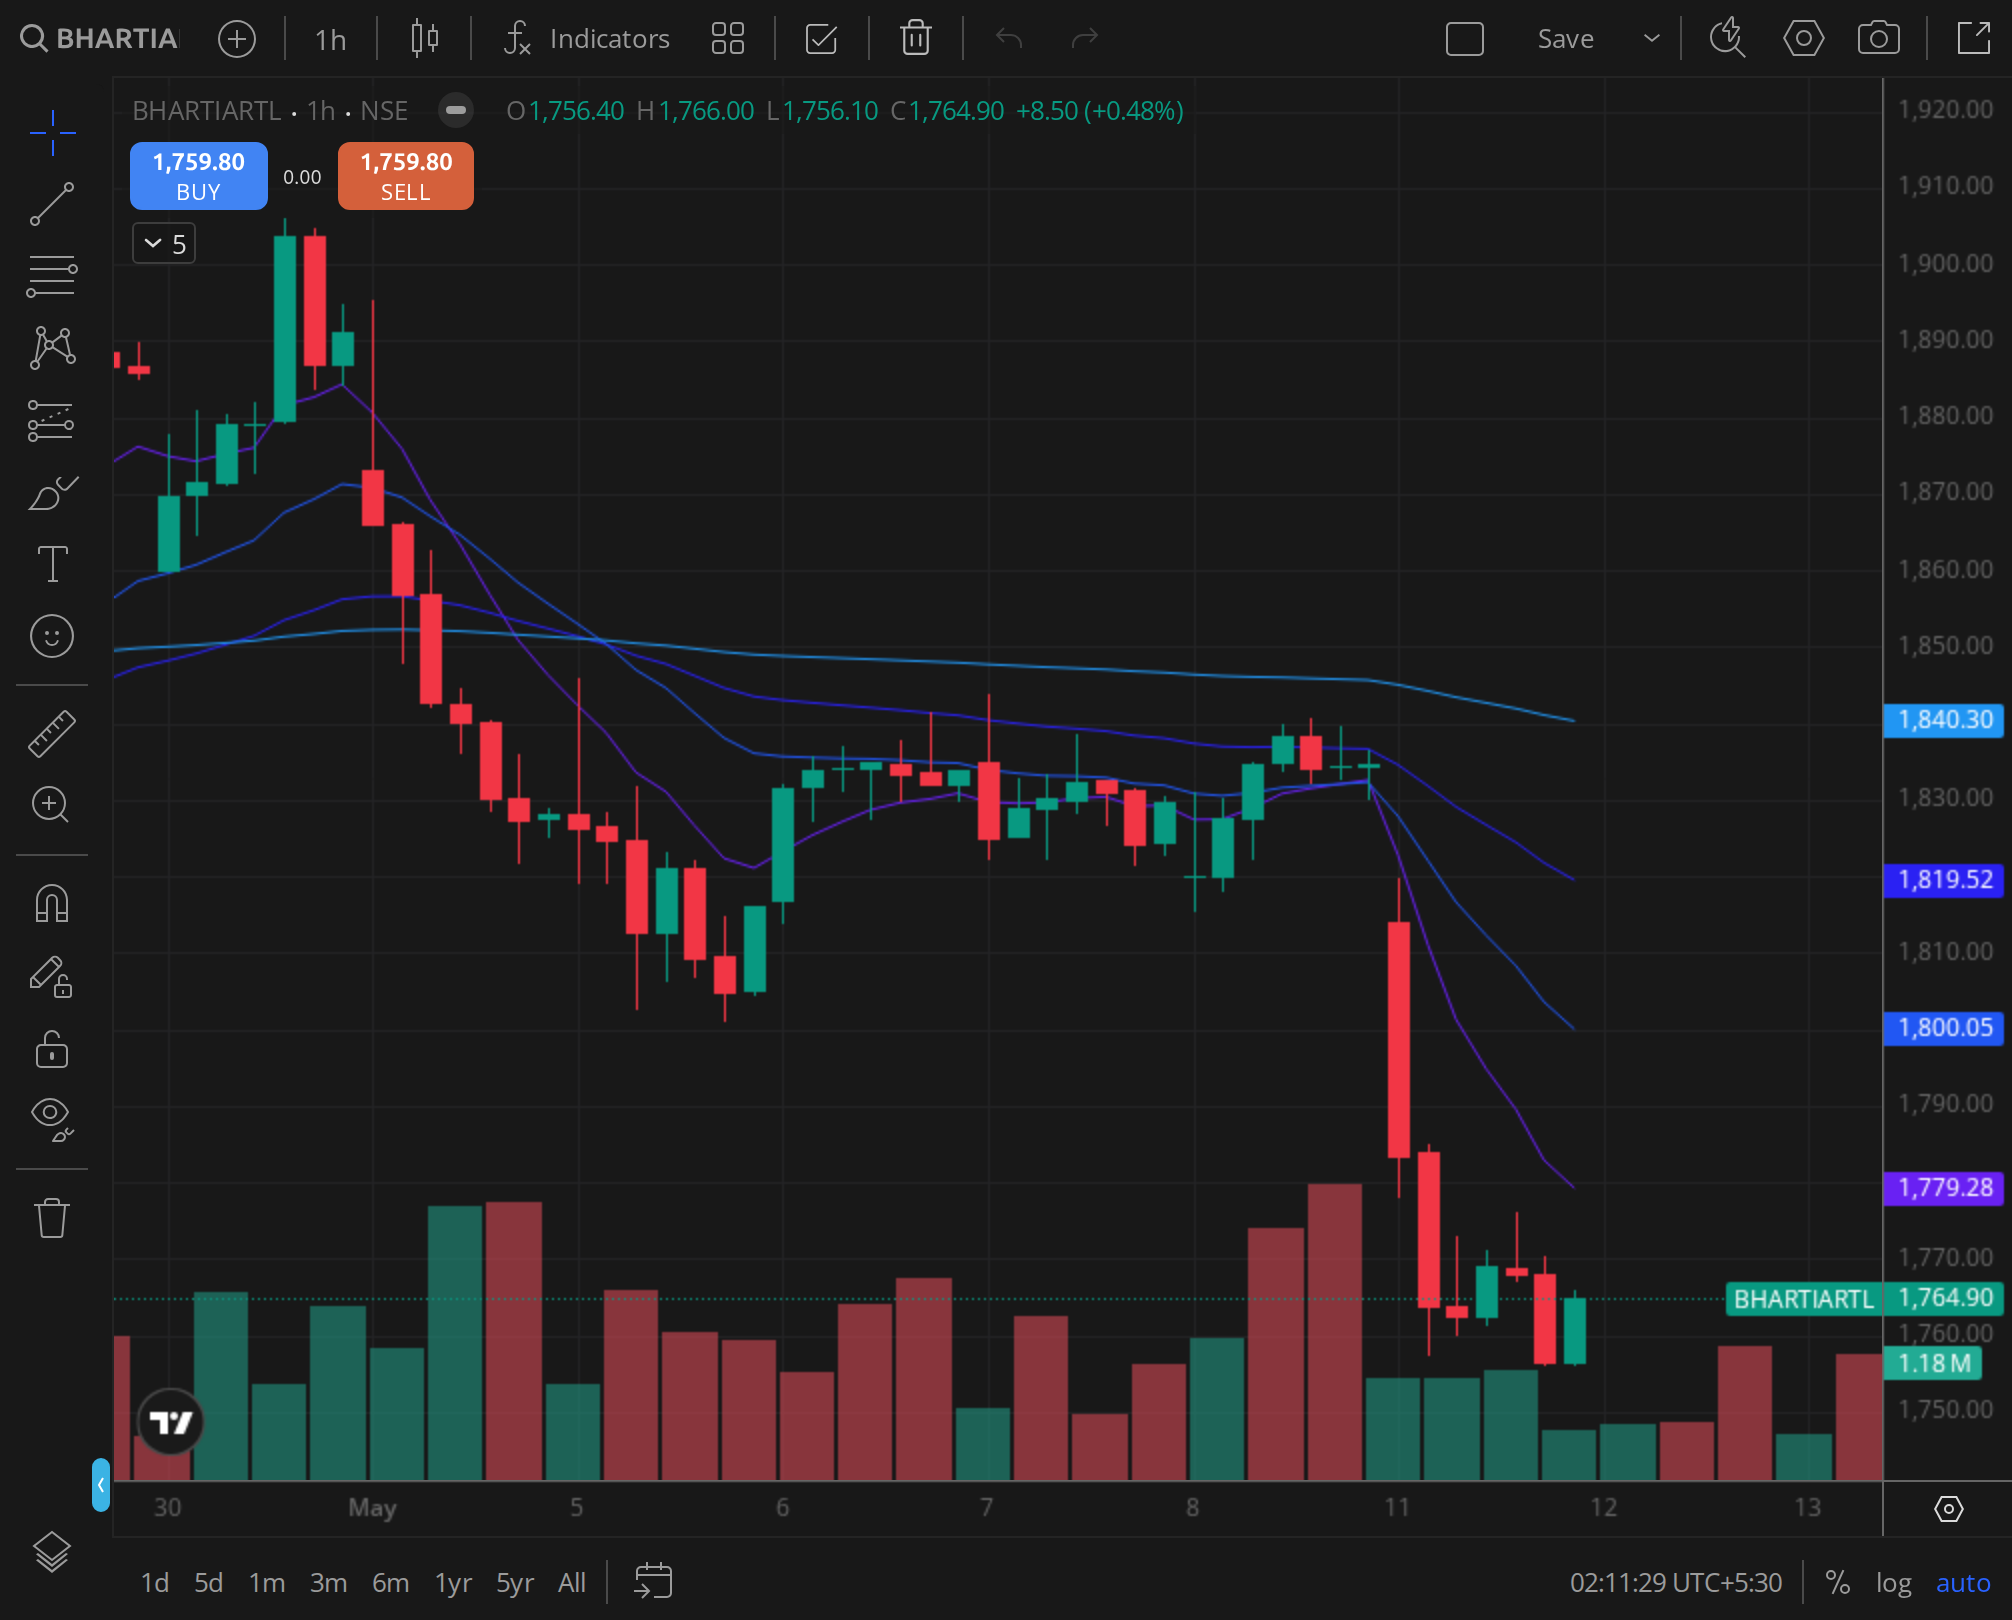
Caption: BHARTIARTL 30min timeframe around 2025-04-11.
The 5% drop in late February was not, a single-cause event. It came at the intersection of three things landing on the same screen. A Mint report flagged delegate chatter that DoT and operators were not on the same page about timelines for the next tariff move. The Nifty itself was in a defensive churn after the late-January Budget gave the indices very little new to chew on. And Jio's prepaid arithmetic, after the December hike, had produced ARPU disclosures from the Reliance Industries quarterly that some on the sell side read as setting a competitive ceiling rather than a floor. None of these on their own would have moved a ₹9-lakh-crore market cap stock that much. Together, sitting on top of a tape that had already been long Airtel via index weight, FII top-up, and the predictable insurance flows, they did.
The weekly structure is where the longer argument lived. From the ₹770 levels of April 2023 the stock had moved in three distinct legs, and each leg had been preceded by a quarter in which net subscriber additions held positive while ARPU stepped up. The first leg, through to August 2023, was the deleveraging trade. The second, broadly through 2024, was the 5G-and-tariff-hike rerating. The third, which began in early 2024 and was still in force when the February correction hit, was the one in which the market had begun to count Airtel as a 25-times-earnings telco rather than a 12-times-EBITDA infrastructure operator. Each transition had compressed the implied risk premium, and each had left the weekly 50-period moving average rising at a tighter slope. The drawdown that began on February 25 was the first weekly close below the rising 20-week line in roughly twelve months. That is the technical fact that mattered for positioning desks. It is not by itself a sell signal. It is, however, the signal that says the marginal buyer has changed.
What replaced the marginal buyer through March was the kind of flow that telecom in India has historically struggled to attract in size. Domestic institutional, specifically the insurance and pension book, stepped up. The reason was not a single broker note. It was a structural one. Airtel's free cash flow conversion, after the AGR overhang had been worked through and after the 5G capex peak had visibly rolled off, looked unusually clean for a domestic large cap with a near-monopoly characteristic in its second-largest revenue line. The DTH wind-down was already in price. The enterprise business was scaling without needing much incremental capital. Africa was no longer a destabiliser. For a desk that needed a yield-adjacent industrial in a market where private banks were range-bound and FMCG was demand-soft, the stock was, by mid-March, doing the job of a defensive at a growth multiple.
The fundamental print closest to the focus date was the December quarter result, which had been delivered in early February. The takeaways from that release had been digested before the correction, not after, which is one of the reasons the late-February drop felt structurally awkward. Subscriber adds had been better than peers. The post-paid mix, the line item that telecom analysts increasingly use as a proxy for stickiness, had improved. The India mobile ARPU print had been broadly in line with what management had been guiding, and the implied 4G-to-5G migration math suggested the tariff hike of December 2024 was still being absorbed through the base rather than already showing up fully in the print. The bear note that ran through the second week of March argued the opposite, that the absorption was effectively complete and that the next leg of ARPU growth would need a second hike that political timing was making harder to call. The bull note from a domestic broker, which landed in the last week of March, argued that even at flat tariffs the operating leverage from the mix shift and from churn at the bottom of the prepaid pyramid was enough to deliver consensus EBITDA. Both notes had a case. The tape, by the end of March, was clearly listening to the second one.
The daily moving average stack was the cleanest read of the recovery. After the February drop, the stock spent the first two weeks of March trading below its 20-day and 50-day lines, with the 50-day acting as resistance on the first bounce attempt. The reclaim of the 20-day, around the third week of March, came on a session in which volume was notably above the 30-day average and the close was in the upper third of the day's range. That kind of session, on a stock where the float is what it is and the FII share is what it is, is rarely a coincidence. It usually means a desk has been told to add. The 50-day was reclaimed in the first week of April, and from there the move into the focus date was orderly. The April 11 close at ₹1,674.35 sat above all three of the relevant short-term lines, with the 20-day rising and the 50-day flattening into a turn. None of that, on its own, called the next move. It did, however, take the technical case off the bear side of the ledger.
The sentiment picture in the F&O book was the more interesting read. Through late February and into early March the option chain had shown a building of out-of-the-money put open interest at the ₹1,500 and ₹1,520 strikes, which was consistent with hedging rather than directional bearishness. As the stock based and then recovered, that put OI did not unwind in any panic. It rolled, strike by strike, higher. By the week of April 7 the heavier put OI was sitting around the ₹1,600 mark, which is the behaviour you see when long-only books are protecting a position rather than trying to flip it. On the call side, the build-up around ₹1,700 through the first half of April was thinner than it had been at equivalent prior peaks. That asymmetry mattered. It suggested that the marginal seller of upside was not yet aggressive, and that the option market had not, by the April 11 close, fully priced in a continuation through the prior swing high.
FII positioning in the single-stock futures, judging by the broad weekly disclosures and the implied changes in client-category open interest that derivatives analysts track, had stayed net long through the correction. The drawdown was absorbed by liquidation in the prop and high-net-worth books rather than by foreign futures unwind. That is the kind of detail that does not show up in headline coverage but that matters for the durability of a move. A correction held up by retail and prop, with FII derivative length intact, tends to retrace faster than one in which foreign futures roll out.
The brokerage flow through the window followed a familiar pattern. The downgrade, when it came in the second week of March, came from a global house with a price target cut that read more as a discount-rate adjustment than a thesis change. The upgrade, which came in the final week of March from a domestic house, leaned on the cash-flow argument and on the dividend yield. By the first week of April, consensus had nudged the twelve-month target back toward the pre-correction range, and the buy-rating count was where it had been at the start of the year. The market does not always agree with consensus, and consensus does not always agree with itself, but the directional move in target prices through April was a tailwind rather than a headwind.
The intraday volume signature in the week of the focus date was where the conviction read sharpest. The session of April 11 itself opened firm, traded a narrow morning range, and then expanded on volume into the second half of the day. The 30-minute chart showed the classic pattern of an institutional accumulation week, with the bigger volume bars sitting on the up-candles and the down-candles in the week being shorter in body and lower in volume. That pattern does not, by itself, predict the next session. It does say that the bid was real, and that the close at ₹1,674.35 was not a thin print.
The historical analog that came up most often in the desk notes was the 2022 setup, in which the stock had corrected on a similar tariff-timing worry, based for roughly five weeks, and then resumed its uptrend on the back of a quarter that vindicated the ARPU trajectory. The differences in 2025 were that the absolute level was higher, the ownership had shifted toward domestic institutional, and the cash-flow case was stronger. The similarity was that in both episodes the market was being asked to underwrite pricing power in a regulated industry with two-and-a-half meaningful operators, and in both episodes the answer the tape gave was, eventually, yes. A 2020 analog from the post-AGR period also surfaced in the discussion, although the structural backdrop then, with debt and dilution risk live, was different enough that the comparison did more rhetorical than analytical work.
What the April 11 print said, taken in the round, was that the market had decided the late-February scare was a positioning correction rather than a thesis break. The stock had given back roughly the second half of its January advance, found a bid where the longer-term moving averages and the structural ownership base wanted it to find one, and then walked back up the staircase. The bear case, that tariff hikes were a one-way door that had now shut for the year, had not been refuted by data. It had been deferred by the absence of disconfirming data, which is often how telecom debates resolve in India.
The five-day forward read into the April expiry week was that the stock was likely to test the prior swing high zone, that the option market had not yet built enough resistance overhead to make that test a hard one, and that the wider tape, with the index itself trying to base around the budget-month range, was not pulling Airtel in either direction with any force. The longer one-month and three-month reads depended on the March-quarter print, which was the next real catalyst on the calendar, and on whether the management commentary on the call moved the tariff conversation in either direction. The risk-reward into that print, at ₹1,674.35, was not as attractive as it had been at the February low, but it was meaningfully better than it had been at the January high.
VERDICT
- Stance: BULLISH
- Horizon: 1mo
- Rationale: Late-February correction was a positioning flush, not a thesis break. Daily MA stack, option-chain roll-up, and intraday accumulation through the week of April 11 all read as a base being defended by domestic institutional buyers. Next catalyst was the March-quarter print, and the setup into it favoured the long side over a one-month horizon, with the prior swing high as the first technical objective.