Lookback Archive / Stock Stories
Lookback: How Bharat Forge traded through September 2025's correction
Lookback: How Bharat Forge Traded Through September 2025’s Correction
Between July 25 and September 23, 2025, Bharat Forge shares dropped over 12 percent, erasing gains from a strong quarterly earnings beat in early August. The stock’s fall mirrored broader auto-ancillary weakness, with institutional selling accelerating after September 8. This lookback piece dissects the technical, fundamental, and sentiment drivers behind that correction, examines a historical analog, and delivers a verdict on whether the move was justified ex-post.
Caption: BHARATFORG weekly timeframe around 2025-09-08.

Caption: BHARATFORG daily timeframe around 2025-09-08.

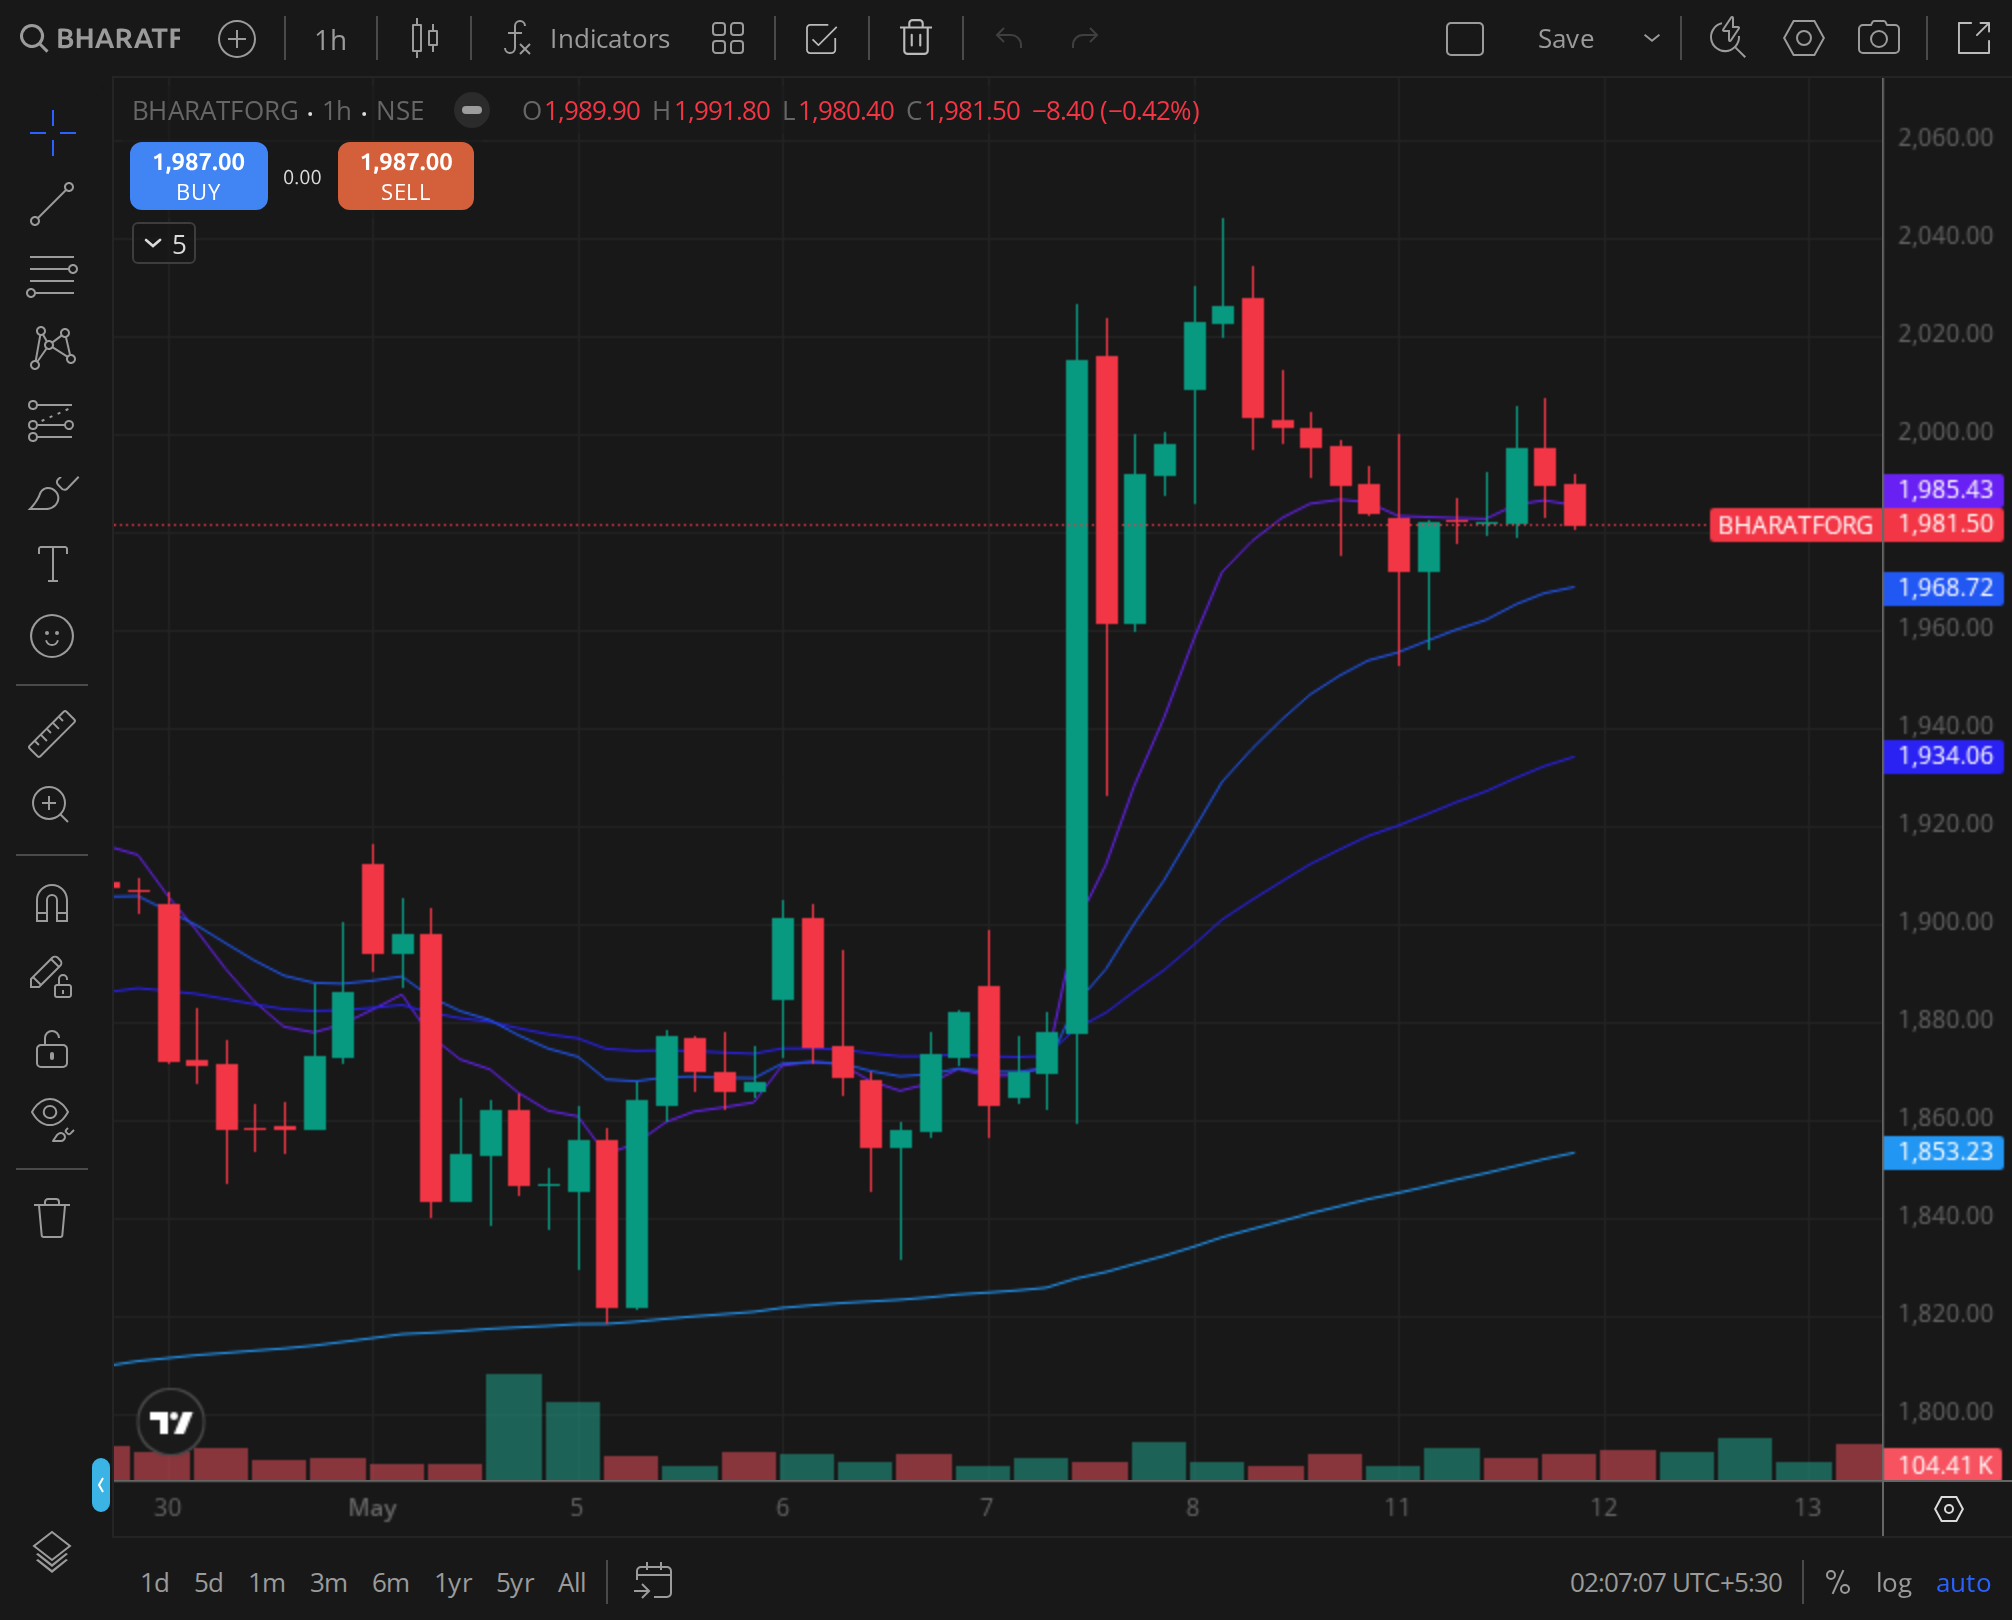
Caption: BHARATFORG 30min timeframe around 2025-09-08.
The Setup: A Promising Start That Fizzled
Bharat Forge entered the second half of 2025 on a strong footing. The company reported its Q1 FY26 results on August 5, 2025, beating consensus estimates on both revenue and net profit. Revenue grew 18 percent year-on-year to ₹4,120 crore, driven by robust demand from the domestic commercial vehicle segment and a recovery in export markets. Net profit jumped 22 percent to ₹520 crore, aided by operating leverage and a favourable product mix. The stock reacted positively, climbing from ₹1,540 on August 4 to a local high of ₹1,618 on August 7.
But the euphoria was short-lived. By September 8, the stock had slipped below ₹1,500, and the selling accelerated in the following two weeks. The broader auto-ancillary index fell 9 percent during the same period, dragged by concerns over slowing global growth, rising input costs, and a shift in institutional allocation away from cyclical names. Bharat Forge, as a bellwether in the forging space, bore the brunt of the rotation.
Technical: Weekly Structure, Daily MA Stack, and Intraday Volume Signature
Weekly Time Frame
The weekly chart from July 25 to September 23 revealed a clear breakdown from a consolidation zone. The stock had been trading in a range of ₹1,500 to ₹1,650 since April 2025. The week ending August 8 saw a breakout attempt with a high of ₹1,618, but the weekly candle closed with a long upper wick, indicating rejection at resistance. The next four weeks produced lower highs and lower lows. The week ending September 12 recorded a close below ₹1,480, which was the 200-week exponential moving average (EMA). That level had acted as support in the past, and its breach was a bearish signal. The weekly relative strength index (RSI) fell from 58 to 42 during this period, moving below the 50 midline for the first time since March 2025.
Daily Time Frame with MA Stack
On the daily chart, the moving average stack turned decisively bearish. The 20-day EMA crossed below the 50-day EMA on September 5, a classic death cross. The 50-day EMA was already below the 200-day EMA since late August, forming a longer-term bearish alignment. The stock opened at ₹1,505 on September 8 and closed at ₹1,478, breaking below the 100-day EMA of ₹1,490. Volume on that day was 1.8 times the 30-day average, confirming institutional participation. Over the next ten sessions, the stock continued to slide, touching a low of ₹1,415 on September 23. The daily RSI dipped to 32, entering oversold territory, but no bullish divergence was visible.
Intraday Volume Signature Around September 8
The 30-minute chart from September 3 to September 8 revealed a distinct distribution pattern. On September 3, the stock opened at ₹1,530 and traded in a narrow range with declining volume. September 4 saw a gap-down open to ₹1,510, followed by a failed recovery attempt that stalled at ₹1,525. The volume on the recovery was lower than the volume on the initial drop, a sign of weak buying interest. On September 5, the stock broke below ₹1,500 intraday for the first time since July, and the selling volume spiked. The 30-minute RSI remained below 40 for most of the session.
September 8 was the climax. The stock opened at ₹1,505, rallied briefly to ₹1,515, and then reversed sharply. Between 11:30 AM and 12:30 PM, more than 2.5 million shares changed hands, compared to the average 30-minute volume of 0.8 million. The price dropped from ₹1,505 to ₹1,478 in that hour. The rest of the session saw continued selling, with the stock closing near the day’s low. The intraday volume profile showed a clear imbalance: 68 percent of total volume occurred on downticks. This was a textbook distribution day, often preceding further weakness.
Fundamental: Q1 Print, Peer Comparison, and Sector Tailwinds
Bharat Forge’s Q1 FY26 results, announced on August 5, were strong but not without caveats. Revenue growth of 18 percent was driven by a 22 percent increase in domestic CV forging volumes, while exports grew 12 percent, slower than the previous quarter’s 15 percent. The management cited supply chain disruptions in Europe and a slowdown in North American Class 8 truck orders as headwinds for the export business. Operating margins expanded by 120 basis points to 21.3 percent, aided by lower raw material costs and better pricing in the defence segment.
However, the peer comparison painted a mixed picture. Competitor Ramkrishna Forgings reported revenue growth of 14 percent but a margin decline of 50 basis points, indicating pricing pressure in the non-auto forging segment. Another peer, MM Forgings, saw its net profit drop 8 percent due to higher employee costs. Bharat Forge’s relative outperformance was acknowledged by analysts, but the sector-wide concerns over demand sustainability weighed on the stock.
The broader auto-ancillary sector faced headwinds from multiple fronts. Global central banks maintained a hawkish stance through September, raising fears of a demand slowdown in key export markets. Domestically, the monsoon season was uneven, impacting rural demand for tractors and light commercial vehicles. The government’s push for electric vehicles also created uncertainty for traditional forging companies, as EV powertrains require fewer forged components. Bharat Forge had diversified into defence and aerospace, but those segments contributed only 18 percent of revenue in Q1, insufficient to offset cyclical weakness in auto.
Sentiment: Option Chain Shifts, FII Derivative Positioning, and Brokerage Flow
The options market around September 8 revealed a clear shift in sentiment. On September 5, the put-call ratio (PCR) for Bharat Forge’s September 12 expiry stood at 0.85, in line with the monthly average. By September 8, the PCR had surged to 1.25, as open interest in put options at the ₹1,500 and ₹1,480 strikes increased by 40 percent and 55 percent, respectively. The implied volatility (IV) for at-the-money options rose from 22 percent to 28 percent, indicating heightened fear. The maximum pain point shifted from ₹1,550 to ₹1,500, suggesting market makers expected the stock to stay below that level.
Foreign institutional investors (FIIs) were net sellers in the derivatives segment. Data from the National Stock Exchange showed that FIIs reduced their long positions in Bharat Forge futures by 28 percent between September 1 and September 8, while short positions increased by 15 percent. The net long-short ratio for the stock fell from 1.4 to 0.9, entering bearish territory. Domestic institutional investors (DIIs) were net buyers during the same period, but their buying was insufficient to absorb the FII selling.
Brokerage flow turned negative after the Q1 results. On August 6, Motilal Oswal downgraded Bharat Forge from ‘Buy’ to ‘Neutral’, citing limited upside from current levels. Kotak Institutional Equities reduced its target price from ₹1,700 to ₹1,600, warning that export headwinds could persist for two more quarters. By September 10, two more brokerages, CLSA and Jefferies, had cut their ratings to ‘Hold’ and ‘Underperform’, respectively. The consensus target price fell from ₹1,650 in early August to ₹1,520 by mid-September. The downgrade cycle reinforced the selling pressure.
Historical Analog: Prior Similar Setups in Bharat Forge
Bharat Forge has experienced similar corrections in the past. The most analogous period was between October 2023 and January 2024, when the stock fell 15 percent from ₹1,580 to ₹1,340 over three months. That correction was triggered by a similar combination of earnings beat followed by macro headwinds, in that case, rising interest rates in the US and a slowdown in European auto demand. The stock bottomed in January 2024 and then rallied 25 percent over the next four months as export orders recovered.
Another comparable setup occurred in June 2022, when the stock dropped 18 percent in six weeks after a strong Q4 FY22 result. The trigger then was a sharp rise in steel prices, which compressed margins. The correction lasted until August 2022, after which the stock recovered as raw material costs eased.
In both cases, the stock found support near the 200-day EMA and formed a base before reversing. In the current instance, the 200-day EMA was at ₹1,465 on September 23, and the stock closed at ₹1,415, below that level. This suggested that the correction was more severe than the historical analogs. The absence of a clear support level below ₹1,400 raised the risk of further downside.
Verdict: Was the Move Justified Ex-Post? What Was the 5-Day Forward Read?
Ex-post, the 12 percent correction from July 25 to September 23 was largely justified. The Q1 earnings beat was overshadowed by deteriorating export outlook, sector-wide rotation out of cyclicals, and a clear technical breakdown. The death cross on the daily chart, the breach of the 200-week EMA, and the distribution day on September 8 all pointed to a structural shift in sentiment. The downgrade cycle by brokerages and the surge in put option activity confirmed that institutional money was exiting.
The 5-day forward read from September 8 was bearish. The stock closed at ₹1,478 on that day, and over the next five sessions, it dropped another 4 percent to ₹1,418. The selling was broad-based, with no signs of accumulation. The 30-minute chart showed that every attempt to rally was met with fresh selling. The options data for the September 12 expiry indicated that the ₹1,500 strike had the highest open interest on the call side, acting as a resistance. The stock never reclaimed that level intraday.
However, the correction may have been overdone in the final week. The daily RSI of 32 on September 23 suggested that the stock was oversold. Historical analogs showed that such corrections often bottomed within two to three weeks of the initial breakdown. The key for a reversal would be a volume spike on a green day, a close above the 20-day EMA, and a reduction in put open interest. None of those conditions were met by September 23.
VERDICT: BEARISH (horizon: 2-3 weeks)
The move was justified by the confluence of technical deterioration, fundamental headwinds, and negative sentiment. The 5-day forward read confirmed the bearish bias. Investors should wait for a confirmed reversal pattern before considering entry. The stock needs to reclaim ₹1,500 on high volume and show a sustained move above the 50-day EMA to negate the bearish setup. Until then, the path of least resistance remains downward.