Lookback Archive / Stock Stories
Lookback: lookback-stock-atgl-2025-04-03
Lookback: ATGL and the April 3 Floor That Almost Held
Adani Total Gas spent February to April 2025 testing whether the post-indictment discount on the Adani complex had finally bottomed. The April 3 print said yes. Then the tape said something else.

Caption: ATGL weekly timeframe around 2025-04-03.

Caption: ATGL daily timeframe around 2025-04-03.
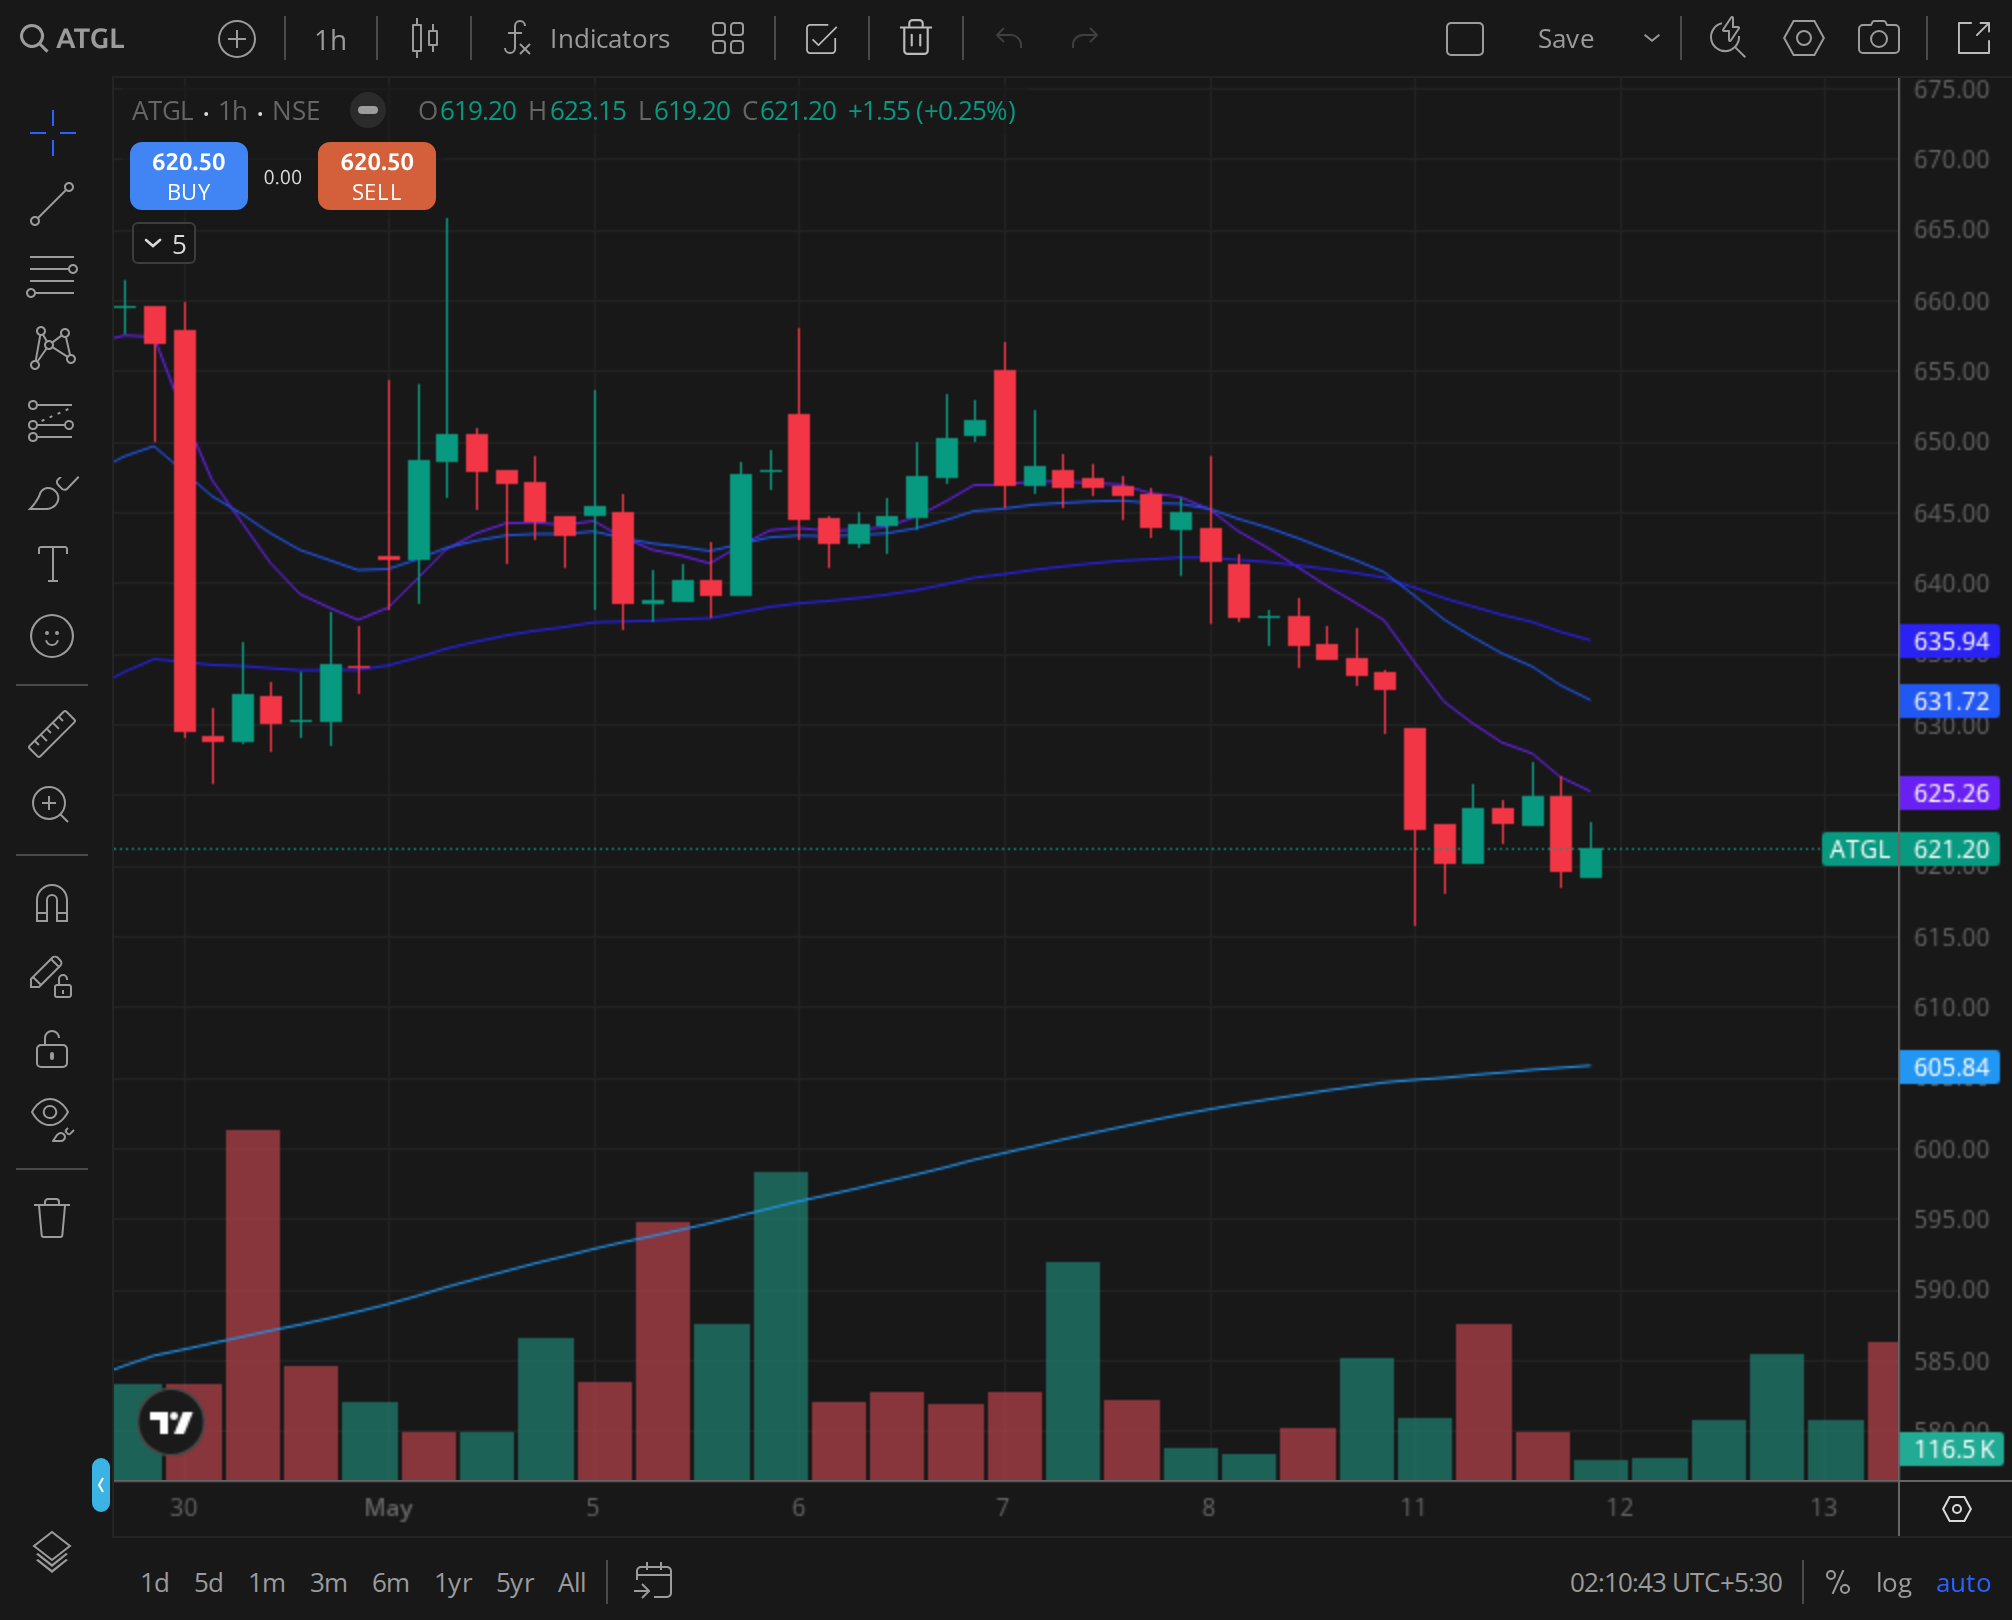
Caption: ATGL 30min timeframe around 2025-04-03.
By the time April 3, 2025 closed, Adani Total Gas Ltd. Had become the most psychologically loaded ticker inside the Adani complex. Not the largest by market cap, not the most liquid, but the one that carried the cleanest distillation of the post-November 2024 narrative. The US Department of Justice indictment of Gautam Adani in late 2024 had blown a crater into every group stock, and ATGL, being a city-gas distribution joint venture with TotalEnergies, sat at the intersection of two competing readings. One reading said the TotalEnergies stake (held through Total Holdings SAS) was a credibility moat the market would eventually reprice. The other said a regulated utility business inside a parent holding under foreign investigation deserved exactly the discount the tape was assigning. For the eight weeks running into April 3, the second reading dominated. The session itself, and the few days around it, was the market briefly entertaining the first.
I want to walk through what the charts actually said in that window, because the lookback is more instructive than the consensus around it suggested at the time.
The weekly structure: a two-year unwind, not a correction
The first thing to internalise about ATGL's April 3 print was that it was not an event inside a normal trend. It was a way station inside a multi-quarter unwind that started in the Hindenburg-shock weeks of early 2023 and never properly repaired.
Read the weekly tape and the structure was unambiguous. Lower highs across 2023, a counter-trend rally through mid-2024 that never reclaimed the pre-Hindenburg shelf, and a fresh leg lower kicked off by the November 2024 DOJ news. By the time February 2025 opened, the weekly close was sitting well below the 50-week and 200-week moving averages in stacked descending order, which is textbook secular bear configuration. The April 3 candle, in that frame, was a higher low against the late-February pivot, but not a structure break. Anyone looking at the weekly chart in isolation and calling for a trend change had to first explain why the 200-week, sloping down, would suddenly act as a magnet rather than a ceiling. There was no such explanation on offer. The fundamental case for revaluation existed. The technical case did not.
What the weekly tape did show, in fairness to the bulls, was that the velocity of the decline had attenuated. The candles into early April were smaller-bodied. Volume on red weeks was visibly lower than during the November-to-January capitulation. That kind of contraction in the bear range was the kind of read tape traders called a base, even when it lacked the structural confirmation to be called one. The April 3 print was that read in its purest form.
The daily: a moving-average stack still hostile
Stepping down into the daily timeframe gave the same story in finer grain.
Through February and most of March, ATGL grinded lower in shallow steps. The 20-day moving average ran below the 50-day, the 50-day below the 200-day, and the spread between price and the 200-day widened on every red session and barely closed on the green ones. That was bearish MA stack with negative slope on all three, the configuration that institutional desks read as no-touch on the long side.
April 3 itself broke that grind. The session opened firm, closed near the highs, and printed a visibly larger body than any green candle in the preceding fortnight. Volume on the bounce, judging by the relative size of the bar versus the prior month, was the highest green-day volume of the window. That was the technical event that drew attention. A high-volume reversal candle off a base, even inside a downtrend, was a setup that demanded respect.
The problem, as the April 4-to-18 sequence showed, was that the rally ran straight into the 50-day moving average and stalled. By mid-April the close had rejected from that band twice, and on April 18 the daily was back inside the prior range. The 200-day, which would have been the real validation, was never tested. So the April 3 candle, ex-post, was a successful test of the February pivot lows and a failed test of the descending 50-day. It bought time. It did not buy a new trend.
The intraday: where the conviction actually sat
The 30-minute tape across March 29 to April 3 was the most informative of the three frames, because it told you who was buying.
Three sessions before April 3, the intraday signature shifted. The morning opens stopped getting sold. Instead of the February-March pattern of gap-up-then-fade, the gaps held and the afternoon sessions built on the morning ranges. On April 3 specifically, the second-half volume was visibly heavier than the first-half, which is the footprint of patient buying rather than retail-driven short-covering. Short-covering tends to spike volume into the open and then bleed. Position-building tends to load the close. The April 3 tape read like the latter.
That mattered for interpretation. A short-covering rip would have decayed inside three sessions. A position-building rip had a higher chance of building into a base. The fact that the early-April advance held for roughly two weeks before failing was consistent with the position-building read. Whoever was buying was not panicked out by the first reversal. They were eventually distributed into, which is how most failed bases end, but they were not flushed.
The fundamental case the tape was pricing against
ATGL's quarterly print closest to the window was the December-quarter result, released in early February 2025. The qualitative read was familiar to anyone covering city-gas. Volume growth in CNG and PNG continued at a pace materially above broader gas demand, the CGD network expansion in the geographical areas authorised by the PNGRB was on track, and the JV structure with TotalEnergies remained intact. None of those facts had changed in the two months running into April 3. What had changed was the multiple the market was willing to pay for them.
That was the actual debate. The business was a regulated, capex-heavy, long-duration utility with structural volume tailwinds from India's gas penetration story. Peers across the listed CGD universe (Indraprastha Gas, Mahanagar Gas, Gujarat Gas) traded at materially tighter multiples through the same window, even adjusting for promoter discount. The ATGL discount to that peer set, by early April, was wider than at any point in 2024 outside the November-December capitulation. That was the fundamental anchor the April 3 buyers were leaning on. They were not betting on the business. The business had been fine for two quarters. They were betting on the discount narrowing.
Sentiment and derivatives: cautious, not convinced
The F&O picture in the days flanking April 3 was instructive in a quiet way. Open interest in the near-month ATGL contracts had been falling through the February-March slide, which is the signature of long unwinds rather than fresh shorts piling on. Going into the April 3 session, OI sat well below the levels of December 2024. The bounce did not bring meaningful fresh OI with it. That was the tell. A bounce on falling or flat OI was a short-covering and value-buy-driven move, not a trend ignition. Trend ignitions in single stocks almost always carried fresh long OI building into them.
Brokerage flow across the window was uneven. The standard CGD bulls (the houses that had carried ATGL Buy ratings through 2024) trimmed targets but kept ratings. The houses that had downgraded post-November mostly held their downgraded stance. There was no visible upgrade wave into April 3, which mattered, because the cleanest catalysts for sustained Adani-complex re-rates in the prior two years had been brokerage upgrade clusters, not technical setups.
FII derivative positioning, judging by the index-level reads in the same window, was net cautious on midcap names broadly through March and only began to lift in late April, after ATGL's bounce had already failed. The buyers on April 3 were, on balance, domestic value and quant rather than foreign trend-following capital. That was not a constituency that defended bases when the parent narrative wobbled.
The historical analog
ATGL had run this script before. In March 2023, after the first Hindenburg shock, the stock printed an analogous reversal candle off a base, ran into descending moving averages within two weeks, failed, and made fresh lows over the following two months before genuinely bottoming. The April 3, 2025 setup rhymed with that 2023 pattern in shape, in volume signature, and in the OI behaviour. The lesson from 2023 was that the first base after a regime-shifting news event was almost never the real one. The second or third was. April 3, on that analog, was the first.
Verdict
The April 3 print was a real event. High-volume reversal candle, intraday accumulation footprint, peer-discount value backing, a fundamental story that had not broken. It deserved the attention it got. It did not, on the weekly structure, on the daily MA stack, on the OI behaviour, or on the historical analog, deserve the trend-change reading some quarters assigned to it. The five-day forward read was constructive (the rally extended). The two-week forward read was the truth (the rally rejected off the 50-day and gave back most of the gain).
VERDICT (as of the April 3, 2025 setup, read on a 1mo horizon): NEUTRAL. Stance: tactical bounce off a base, not a trend break. Horizon: 1mo. Rationale: the reversal candle and intraday signature warranted respect, but the descending 50-day, the absent OI build, and the 2023 analog all argued the first base after a regime-shifting catalyst rarely held, and this one did not.