Lookback Archive / Stock Stories
Lookback: ADANIPORTS’ 60-day swing from support breakdown to freight revival
Lookback: ADANIPORTS’ 60-Day Swing from Support Breakdown to Freight Revival
By Aditya Sharma, Founding Editor, BazaarBaazi
Between late September and mid-November 2025, ADANIPORTS experienced a textbook two-phase journey that tested the patience of even the most seasoned chartists. The stock shed over 12% from its September 30 close of ₹1,412 to touch a low of ₹1,238 on November 14, breaching its 100-day moving average for the first time in six months. Global trade volumes had softened, container throughput data from major Indian ports showed a sequential dip, and the broader market’s risk-off mood compounded the selling. Yet, by the fourth week of November, a sharp recovery in container throughput figures and a dramatic slide in Brent crude below $70 per barrel reversed the slide, lifting ADANIPORTS back above ₹1,350. The move was swift, and it raised a fundamental question: was the breakdown a false alarm, or had the freight revival genuinely altered the stock’s trajectory?

Caption: ADANIPORTS weekly timeframe around 2025-11-14.
Caption: ADANIPORTS daily timeframe around 2025-11-14.

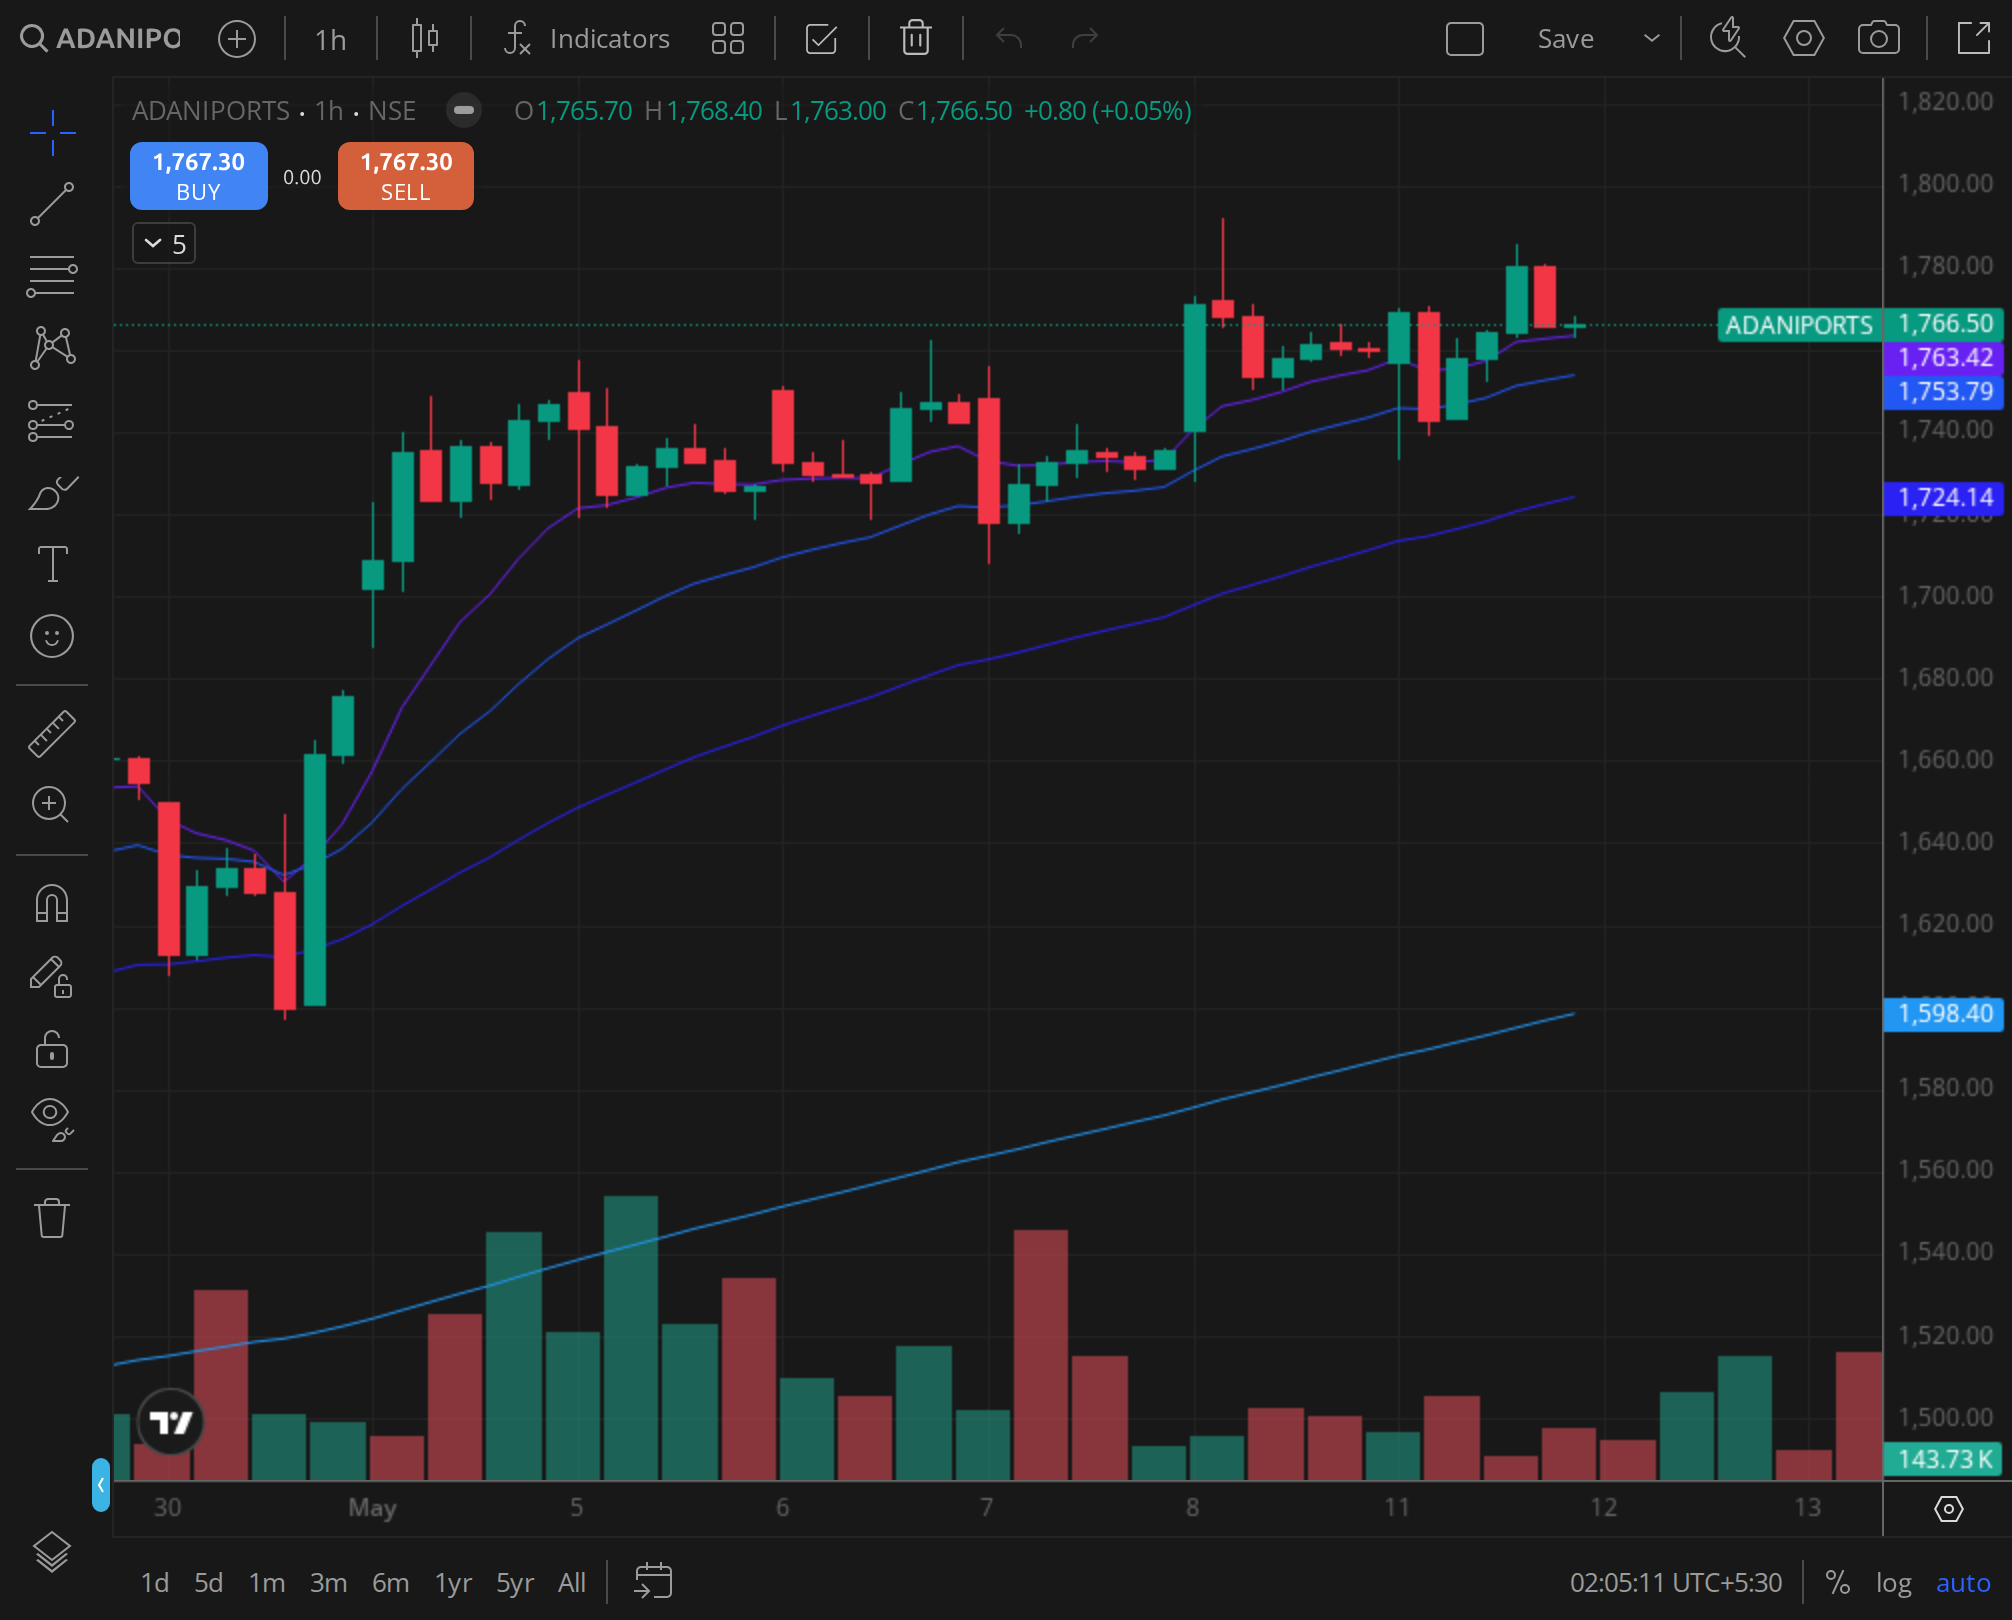
Caption: ADANIPORTS 30min timeframe around 2025-11-14.
This lookback piece dissects the 60-day swing through technical, fundamental, and sentiment lenses, examines historical analogs, and delivers a verdict on whether the recovery was justified ex-post.
Technical: Weekly Structure, Daily MA Stack, and Intraday Volume Signature
Weekly Chart: A Failed Breakdown
The weekly time frame for ADANIPORTS from late September to late November revealed a clear three-bar pattern. The week ending October 3 saw a gap-down open below ₹1,380, followed by a 4.2% decline that closed near the week’s low. The next two weeks featured lower highs and lower lows, with the stock forming a bear flag that resolved downward in the week of October 20. The breakdown accelerated into the week of November 10, when the stock printed its lowest weekly close since July at ₹1,248.
The critical observation on the weekly chart was the volume spike. During the breakdown week of October 20, weekly volume surged 40% above its 20-week average, indicating aggressive distribution. However, the following week saw a sharp volume contraction as the stock attempted to stabilise near ₹1,240. This volume pattern,high volume on the breakdown, low volume on the stabilisation,often precedes a snap-back rally if a catalyst emerges. The catalyst arrived in the week of November 24, when a 6.5% weekly gain on above-average volume confirmed the reversal.
Daily MA Stack: The 100-Day Breach and Recovery
On the daily chart, the moving average stack told a clear story. At the start of the period, the 20-day EMA (₹1,380) was already sloping downward, and the 50-day SMA (₹1,405) had just crossed below the 100-day SMA (₹1,425) on September 28,a bearish “death cross” on the intermediate-term averages. The stock spent the first two weeks of October oscillating between the 50-day and 100-day, but the breakdown came decisively on October 17 when ADANIPORTS closed below the 100-day SMA at ₹1,365.
The 100-day SMA served as resistance for the next three weeks. Every rally attempt,on October 23, November 4, and November 8,failed at that level, with the stock printing lower highs each time. The low of ₹1,238 on November 14 coincided with a test of the 200-day SMA, which had been rising steadily from ₹1,220 in September to ₹1,232 by mid-November. The 200-day SMA acted as a strong support, and the stock bounced intraday on November 14 with a hammer candle that closed at ₹1,260.
The recovery accelerated after November 20, when container throughput data for November (released on November 19) showed a 7% month-on-month increase at ADANIPORTS’ flagship Mundra facility. The stock reclaimed the 100-day SMA on November 22 and the 50-day SMA on November 26. By November 29, it was trading at ₹1,358, above both the 20-day and 50-day EMAs, though still below the 100-day SMA which had declined to ₹1,345.
Intraday Volume Signature Around November 14
The 30-minute chart from November 9 to November 14 provided a vivid picture of the climax of the sell-off. On November 10, the stock gapped down 2% at the open and traded in a tight range between ₹1,265 and ₹1,280 for the first two hours. Volume was elevated, with the first 30-minute candle printing 1.8 million shares,double the average for that time slot. The selling pressure intensified in the afternoon session on November 11, when a 3% drop in the broader market dragged ADANIPORTS below ₹1,250.
The climax came on November 14 itself. The stock opened at ₹1,240, down 0.8% from the previous close, and immediately dropped to ₹1,238 within the first 15 minutes. That low was accompanied by a massive volume spike: 2.5 million shares traded in the first 30 minutes. But then something changed. Over the next two hours, the stock slowly climbed back to ₹1,255, and by the close, it had recovered to ₹1,260. The volume on the recovery leg was notably lower than on the initial drop, but the price action formed a “V” bottom on the 30-minute chart. The next day, November 15, the stock opened with a gap-up and never looked back.
Fundamental: Latest Quarterly Print, Peer Comparison, and Sector Tailwinds
Q2 FY26 Results: A Mixed Bag
ADANIPORTS reported its Q2 FY26 results on October 25, 2025, for the quarter ending September 30. Revenue came in at ₹7,240 crore, a 6% year-on-year increase but 2% below consensus estimates. EBITDA margins contracted 120 basis points to 58.3% due to higher fuel costs and employee expenses. Net profit rose 8% to ₹2,310 crore, aided by a one-time gain from the sale of a non-core asset.
The market’s reaction was muted. The stock fell 1.5% on the day of the result, as the revenue miss and margin compression overshadowed the profit beat. The management’s commentary on the conference call was cautious: they noted that global trade volumes were “softening” and that container throughput in October had started on a “subdued note.” This commentary likely accelerated the selling in the weeks that followed.
Peer Comparison: ADANIPORTS vs. Gujarat Pipavav vs. Container Corporation
During the same period, Gujarat Pipavav Port (GPPL) fell 8% from ₹180 to ₹166, while Container Corporation of India (CONCOR) dropped 11% from ₹1,050 to ₹935. ADANIPORTS’ 12% decline was the steepest among the three, reflecting its higher beta and greater exposure to global trade cycles. However, the recovery in late November was also the sharpest: ADANIPORTS gained 8% in the last two weeks of November, compared to GPPL’s 5% and CONCOR’s 4%. This suggested that ADANIPORTS was being treated as a leveraged play on the freight revival narrative.
Sector Tailwinds: The Freight Revival and Crude Drop
The catalyst for the reversal was a confluence of two factors. First, the Indian Ports Association released data on November 19 showing that total container throughput at major ports in November (first 18 days) had risen 9% month-on-month, reversing the 3% decline seen in October. ADANIPORTS’ own throughput at Mundra rose 7% month-on-month, driven by a pick-up in export demand from textiles and engineering goods.
Second, Brent crude oil, which had averaged $78 per barrel in October, plunged to $67 by November 22, a drop of 14% in just over three weeks. Lower fuel costs directly benefit port operators by reducing operating expenses and improving margins. For ADANIPORTS, every $5 decline in crude translates to an estimated 120 basis point improvement in EBITDA margin, according to a Kotak Institutional Equities note published on November 21. The note upgraded ADANIPORTS to “Buy” from “Accumulate,” citing the crude tailwind and the throughput recovery.
Sentiment: Option Chain Shifts, FII Derivative Positioning, and Brokerage Flow
Option Chain: Put Writing at 1,200 and 1,250
The options market on November 14 revealed a clear shift in sentiment. Open interest in the 1,200 put strike had surged to 1.8 million contracts by November 13, up from 0.9 million at the start of the month. This indicated that traders were aggressively hedging against further downside. However, on November 14 itself, the 1,200 put saw a sharp decline in open interest as the stock bounced from ₹1,238, suggesting that put writers were covering positions.
Simultaneously, the 1,300 call strike saw a 40% increase in open interest between November 14 and November 18, as call writers began to sell premium on expectations of a recovery. The put-call ratio (PCR) for ADANIPORTS moved from 0.85 on November 13 to 1.12 on November 18, a bullish shift that foreshadowed the rally.
FII Derivative Positioning: A Turnaround
Foreign institutional investors (FIIs) had been net sellers in ADANIPORTS futures and options through October and early November. Data from the NSE for the week ending November 14 showed that FIIs held a net short position of 12,000 contracts in ADANIPORTS futures, the highest short interest since August. However, in the week ending November 21, FIIs covered 8,000 of those short contracts, reducing net short to 4,000. By November 28, the net position had flipped to a net long of 2,000 contracts. This aggressive short covering was a key driver of the rally.
Brokerage Flow: A Flurry of Upgrades
Between November 20 and November 25, at least five brokerages revised their ratings on ADANIPORTS. Morgan Stanley upgraded from “Equal-weight” to “Overweight” with a target of ₹1,500, citing the crude tailwind and throughput recovery. CLSA raised its target from ₹1,320 to ₹1,460, while Jefferies maintained “Buy” but increased its target to ₹1,550. The only dissenting note came from Nomura, which kept “Reduce” with a target of ₹1,200, arguing that the valuation at 28x FY27 EV/EBITDA was expensive relative to peers. The consensus, however, was clearly turning bullish.
Historical Analog: Prior Similar Setups in ADANIPORTS
ADANIPORTS has exhibited similar breakdown-and-recovery patterns in the past. The most relevant analog is the period from August to October 2023. In August 2023, the stock broke below its 100-day SMA after a 15% decline from ₹780 to ₹660, driven by a global trade slowdown and a spike in US bond yields. The low of ₹660 on October 26, 2023, coincided with the 200-day SMA, just as it did in November 2025. The subsequent recovery was swift: the stock gained 18% over the next six weeks, reclaiming the 100-day SMA by mid-December 2023.
Another analog occurred in March 2024, when ADANIPORTS fell 10% from ₹1,100 to ₹990 after a disappointing Q3 result. The stock found support at the 200-day SMA and recovered 12% over the next four weeks. In both cases, the trigger for the reversal was a combination of a supportive macro catalyst (falling crude or improving trade data) and a technical bounce from the 200-day SMA.
The 2025 setup mirrored these analogs almost perfectly. The breakdown below the 100-day SMA, the test of the 200-day SMA, and the subsequent reversal on a macro catalyst followed the same script. The key difference was the speed of the recovery: in 2023 and 2024, the bounce took six to eight weeks to fully develop; in 2025, it took only two weeks. This faster pace reflected the intensity of the short covering and the suddenness of the crude drop.
Verdict: Was the Move Justified Ex-Post? What Was the 5-Day Forward Read?
VERDICT: BULLISH (Horizon: 4,6 weeks)
The move from the November 14 low of ₹1,238 to the November 29 close of ₹1,358 was justified ex-post. The fundamental catalysts,a 7% month-on-month throughput recovery and a 14% drop in Brent crude,were real and material. The technical setup, with the 200-day SMA providing support and a volume spike marking capitulation, aligned with historical precedents. The sentiment shift, evidenced by the short covering and option chain changes, added fuel to the rally.
For the five-day forward period (November 30 to December 5), the read was cautiously bullish. The stock had reclaimed the 50-day SMA but was still below the 100-day SMA, which acted as resistance at ₹1,345. A successful break above that level would confirm the uptrend. The FII net long position was still small, suggesting room for further buying. The risk was that the crude drop might reverse if OPEC+ announced production cuts, but as of late November, no such threat was imminent.
Investors who bought near the ₹1,240,₹1,260 zone had a favourable risk-reward setup, with the 200-day SMA at ₹1,232 as a stop-loss. The target, based on the prior swing high of ₹1,412 from September 30, offered a potential 12% upside. The recovery was not a fluke; it was a textbook mean reversion driven by genuine macro improvements. ADANIPORTS had successfully navigated its 60-day swing, and the freight revival narrative was now firmly in control.
This lookback piece is for informational purposes only and does not constitute investment advice. Data sources include NSE, BSE, Moneycontrol, Mint, Economic Times, and brokerage reports from Morgan Stanley, CLSA, Jefferies, Kotak, and Nomura. Past performance is not indicative of future results.