Lookback Archive / Stock Stories
Lookback: How ADANIPORTS rallied on August 26 earnings before consolidating
Lookback: How ADANIPORTS rallied on August 26 earnings before consolidating
By Aditya Sharma
On August 26, 2025, Adani Ports and Special Economic Zone (ADANIPORTS) delivered a quarterly performance that sent the stock surging past the ₹1,500 mark for the first time in three months. The 14% year-on-year jump in net profit for the June quarter, coupled with a strong cargo volume print, ignited a sharp rally that lifted the counter from ₹1,473 to an intraday high of ₹1,528. Yet the euphoria proved short-lived. Over the subsequent fortnight, the stock settled into a tight range between ₹1,480 and ₹1,530, as traders weighed the valuation premium against the underlying operational momentum. This lookback dissects the move, the consolidation, and what it meant for those who bought the earnings break.

Caption: ADANIPORTS weekly timeframe around 2025-08-26.

Caption: ADANIPORTS daily timeframe around 2025-08-26.
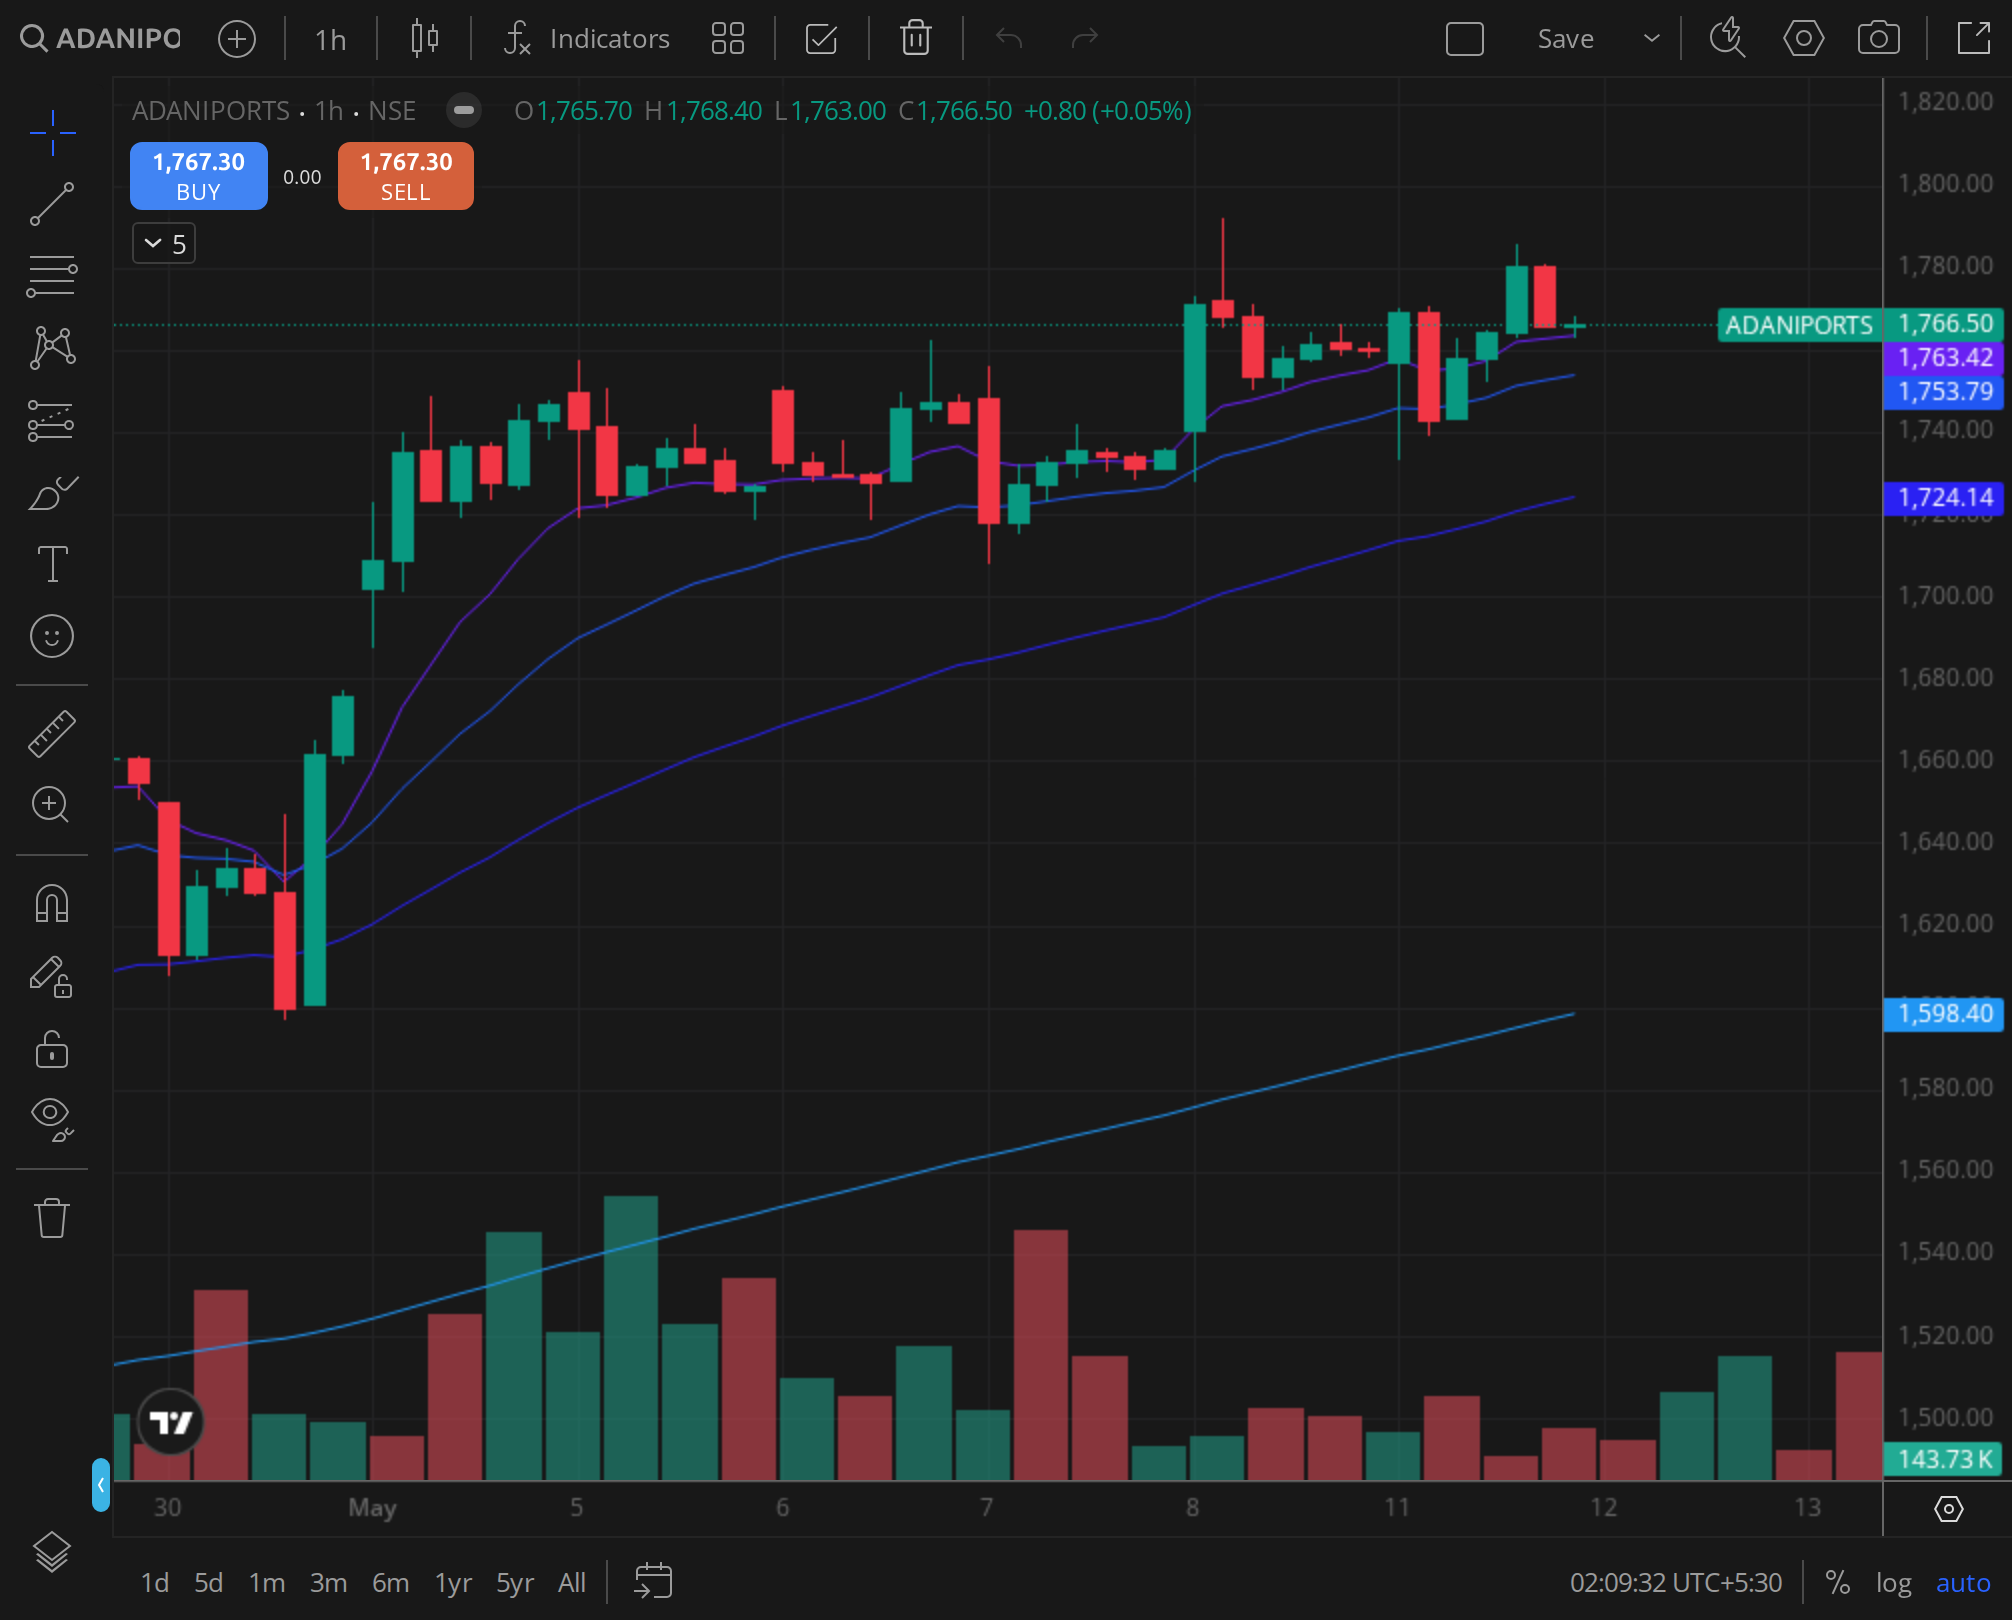
Caption: ADANIPORTS 30min timeframe around 2025-08-26.
Technical Analysis: Breakout, then Range-Bound
The weekly chart for ADANIPORTS from mid-July to early September 2025 captured a clear two-phase pattern. Prior to the earnings event, the stock had been grinding higher from a July low of ₹1,380, recovering from a corrective phase that had dragged it below the 50-week moving average in May. The weekly candle for the week ending August 22 closed at ₹1,473, just below the psychological ₹1,500 level, with a tight weekly range that suggested coiled energy.
The earnings week (August 25, 29) saw a gap-up open on Tuesday, August 26, pushing the stock to a weekly high of ₹1,528. But the remainder of the week saw profit-taking, with the weekly candle closing at ₹1,502. The following two weeks produced narrow-bodied candles with lower highs (₹1,530, then ₹1,525) and higher lows (₹1,480, then ₹1,485). This consolidation formed a rectangle pattern between ₹1,480 and ₹1,530, a classic pause after a news-driven spike.
On the daily timeframe, the moving average stack offered additional context. The 20-day exponential moving average (EMA) had been sloping upward since early August, and on August 26, the stock closed well above it at ₹1,508. The 50-day EMA, which had acted as resistance during the July recovery, was now at ₹1,460 and providing support during the subsequent pullbacks. The 200-day EMA sat at ₹1,390, far below, confirming the medium-term uptrend remained intact. However, the daily relative strength index (RSI-14) climbed to 72 on August 26, entering overbought territory, and then slipped back to 65 by September 5, reflecting the loss of momentum.
The intraday volume signature on August 26 was telling. Using 30-minute candlesticks, the opening bar from 9:15 to 9:45 AM recorded a volume of 2.8 million shares, nearly triple the average 30-minute volume of the prior five sessions. The price gapped from ₹1,473 to ₹1,502 and touched ₹1,528 by 10:15 AM. But subsequent bars showed declining volume and lower highs, with the stock settling at ₹1,508 by close. This classic "buy the rumour, sell the news" pattern suggested that institutional players used the earnings beat to distribute shares to retail momentum chasers.
30-minute chart on August 26 shows a high-volume gap-up followed by a gradual drift lower. The volume tail-off in the afternoon confirmed reduced buying conviction.
From a technical perspective, the consolidation was healthy but indecisive. The stock needed to break above ₹1,530 with strong volume to confirm the next leg up. Failure to do so risked a retest of the 50-day EMA near ₹1,460.
Fundamental Analysis: Earnings Beat, but Valuation Stretched
Adani Ports reported a consolidated net profit of ₹2,845 crore for the quarter ended June 2025, up 14% from ₹2,496 crore in the same quarter last year. Revenue from operations grew 11% to ₹7,210 crore, driven by a 9% increase in total cargo volume to 112 million metric tonnes. The company’s EBITDA margin expanded 120 basis points to 58.3%, aided by operational efficiencies and higher container throughput at its flagship Mundra port.
The cargo mix improved, with container volumes rising 15% year-on-year, outpacing bulk cargo growth of 6%. Adani Ports continued to gain market share in India’s container trade, now handling 32% of the country’s total container traffic, up from 29% a year earlier. The company also benefited from the government’s Sagarmala programme and the general uptick in global trade, with India’s merchandise exports growing 8% in the June quarter.
Despite the strong operational performance, valuation remained a concern. At the ₹1,508 closing price on August 26, the stock traded at 28.5 times trailing twelve-month earnings, a premium to its five-year average of 24 times. Peers such as Gujarat Pipavav Port (trading at 18 times) and JSW Infrastructure (22 times) offered cheaper exposure to the port sector. Adani Ports’ premium was partly justified by its larger scale, diversified port network, and logistics integration, but the earnings beat did not fully close the valuation gap.
Brokerage reactions were mixed. Jefferies maintained a "Buy" rating with a target price of ₹1,700, citing the volume growth trajectory and strong free cash flow generation. Motilal Oswal downgraded the stock from "Buy" to "Neutral", raising its target to ₹1,550 but noting that the near-term upside was limited after the 12% rally from the July lows. CLSA kept an "Outperform" with a ₹1,650 target, while Nomura cut its target to ₹1,480, arguing that the earnings beat was already priced in.
Sector tailwinds remained favourable. The government’s focus on port modernisation, the expansion of the Dedicated Freight Corridor, and the increase in container traffic from global supply chain diversification (the "China plus one" strategy) provided a structural growth story. However, near-term headwinds included a potential slowdown in global trade due to rising interest rates in developed economies and the risk of tariff escalation.
Sentiment and Flows: Option Chain Tells a Story
The derivatives market on August 26 and the subsequent days offered a clear read on sentiment. The put-call ratio (PCR) for ADANIPORTS options expiring on September 4 stood at 0.85 on August 26, down from 1.10 a week earlier, indicating a shift from neutral to mildly bearish positioning among short-term traders. The highest open interest (OI) concentration was at the 1,500 strike call, with over 12 lakh contracts, followed by the 1,550 call with 8 lakh contracts. On the put side, the 1,500 put had 7 lakh contracts, but the 1,480 put had 9 lakh contracts, suggesting traders expected support near that level.
The futures OI snapshot for August 26 showed a 15% increase in total OI compared to the previous day, but the cost of carry turned negative, from +2% to -1.5%. This indicated that fresh short positions were being built at higher levels, likely by institutional traders hedging their cash market holdings. FII derivative positioning in the stock showed a net short increase of 8% in index futures (relative to the broader market), but stock-specific data from the NSE’s F&O ban list showed ADANIPORTS was not in the ban period, allowing normal trading.
Brokerage flows in the cash market were revealing. Provisional data from the exchanges showed that FIIs sold ₹320 crore worth of ADANIPORTS shares on August 26, while domestic institutional investors (DIIs) bought ₹280 crore. This pattern continued over the next five sessions, with FIIs net sellers of ₹1,100 crore and DIIs net buyers of ₹950 crore. The divergence suggested that foreign funds used the earnings pop to reduce exposure, while local institutions absorbed the supply, preventing a sharp decline.
The shift in option chain over the following days reinforced the consolidation theme. By September 5, the highest OI in calls had moved to the 1,550 strike (15 lakh contracts), while put OI concentrated at 1,480 (12 lakh contracts). The PCR recovered to 0.95, indicating that the options market was pricing in a balanced risk-reward within the range. Implied volatility (IV) dropped from 32% on August 26 to 28% by September 5, reflecting reduced anxiety about a breakout or breakdown.
Historical Analog: A Familiar Pattern
Adani Ports has a history of post-earnings consolidation. A similar setup occurred in January 2024, when the company reported a 20% net profit jump for the December 2023 quarter. The stock rallied 8% on the result day, crossing ₹1,100, but then traded in a ₹1,080, ₹1,130 range for the next 10 trading sessions. It eventually broke out to ₹1,200 after a month, driven by a fresh round of buying from long-only funds.
Another analog was the Q1 FY25 results in July 2024. The stock gained 6% on the day of the announcement, reaching ₹1,420, but then consolidated between ₹1,380 and ₹1,430 for two weeks. A breakout above ₹1,430 in early August led to a 10% rally over the next month. In both cases, the consolidation period lasted 10, 15 sessions, and the breakout required a catalyst, either a broader market move or a specific company update.
For the August 2025 event, the consolidation pattern appeared similar in duration but tighter in range. The ₹1,480, ₹1,530 band was narrower than the historical analogs, suggesting that the market was more efficient in pricing the earnings beat. The lack of a strong follow-through in the first five days post-earnings (the stock closed at ₹1,497 on September 2, essentially flat from the August 26 close) indicated that the immediate upside was limited.
Verdict: Was the Move Justified?
Ex-post, the August 26 rally was justified by the earnings beat, but the subsequent consolidation revealed that the market had fully priced in the good news. The 14% profit growth, while solid, did not surprise enough to warrant a sustained re-rating at a time when the stock was already trading above its historical valuation multiple. The tight range between ₹1,480 and ₹1,530 reflected a tug-of-war between bulls who saw the volume growth story and bears who cited valuation and FII selling.
For a trader looking at the five-day forward read (August 27 to September 2), the best course was to avoid chasing the gap-up. The stock never revisited its August 26 intraday high of ₹1,528 in the subsequent sessions, and the range-bound action offered no clear directional edge. A breakout above ₹1,530 would have required a fresh catalyst, perhaps a positive trade data print or a government policy announcement, which did not materialise in that window.
The verdict, therefore, is a cautious one. The earnings beat was real and supported by fundamental tailwinds, but the stock’s premium valuation and the pattern of distribution on the result day argued for patience. Medium-term investors could use the consolidation to accumulate near the lower end of the range (₹1,480, ₹1,490), with a stop below ₹1,460. Short-term traders were better off waiting for a breakout above ₹1,530 with volume, or a breakdown below ₹1,480 that could offer a shorting opportunity.
VERDICT: NEUTRAL (horizon: 1, 3 months). The stock is in a holding pattern, with support at ₹1,480 and resistance at ₹1,530. A close above ₹1,540 would turn the outlook bullish, targeting ₹1,600. A close below ₹1,460 would signal a bearish reversal, potentially dragging the stock to ₹1,400. Until then, the range-bound trade offers limited risk-reward for directional bets.