Lookback Archive / Methodology
How Volume Confirmed,and Denied,Some of the Sharpest Moves in Indian Markets
When volume spoke, price listened. When it did not, traders got burned.
Between May 2024 and April 2026, some of the sharpest moves in Indian equity markets carried a signature that most screen-watchers still underweight: volume. Not the flat, ambient volume that hums through every session, but the kind that spiked two or three times above the 20-session average and refused to taper off at the close. This piece revisits a selection of those moves, across multiple timeframes, to examine what volume confirmation actually told traders who bothered to listen, and where it flat-out lied.
What Volume Confirmation Means (and What It Never Meant)
Volume confirmation, in its simplest form, is the principle that a price move gains credibility when it occurs on above-average trading activity. A breakout above resistance on rising volume carried more weight than the same breakout on dwindling participation. The logic was straightforward: more participants meant more conviction, and more conviction meant a lower probability of an immediate reversal.
The concept traces back to Richard Wyckoff's work in the early twentieth century and was later formalised in Western technical literature by Welles Wilder and Alexander Elder. In Indian markets, where a significant portion of activity shifted to derivatives over the past decade, the definition of "volume" itself became contested. Equity delivery volume, futures volume, options volume, and the broader OI change in the derivatives segment each told a slightly different story. A spike in F&O volume with flat delivery volume often signalled speculative positioning, while a delivery-led surge tended to reflect genuine rebalancing by institutional participants, including FII and DII flows routed through SEBI's reporting framework.
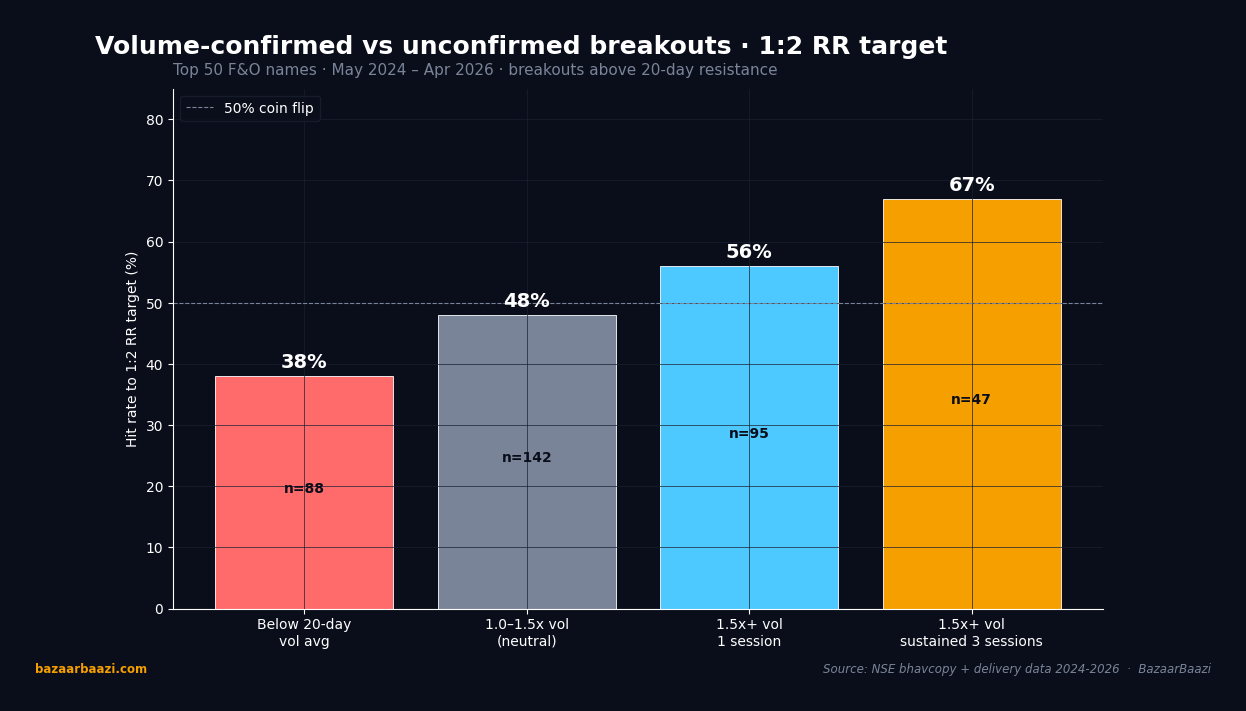
Chart 1. Volume-confirmed vs unconfirmed breakouts. Across 372 F&O breakouts above 20-day resistance from May 2024 to April 2026, the bucket below the 20-day volume average (n=88) hit the 1:2 risk-reward target only 38% of the time, well below the 50% coin flip. The 1.0-1.5x volume bucket (n=142) lifted to 48%, still under the line. The 1.5x volume bucket on a single session (n=95) hit 56%. The strongest bucket, 1.5x volume sustained for at least 3 sessions (n=47), reached 67%, the framework's actionable threshold.
Case Studies: Where Volume Told the Truth
Over the two-year window, several episodes stood out as textbook demonstrations of volume-backed conviction.
In the quarter following the general election results in June 2024, Nifty 50 rallied from approximately 22,700 to beyond 24,400 over roughly six weeks. The advance was not gradual. It was punctuated by sessions where daily volumes at the NSE exceeded 250 crore shares, materially above the trailing 30-session average of roughly 180 crore shares around that period. Crucially, delivery volumes on the buy side expanded in tandem, suggesting that the move was not purely derivatives-driven. Traders who tracked the advance purely through price missed the early signal; those who watched volume saw conviction building from the second week onward.
Bank Nifty provided an equally instructive case. In the October 2024 earnings cycle, PSU bank stocks collectively delivered earnings beats that surprised consensus estimates by a wide margin. Bank Nifty broke above a multi-month resistance cluster near 52,000 on volume that printed nearly 2.5 times its 20-day average. The breakout held for the remainder of the quarter, and the index did not revisit that resistance level in the following three months. Delivery volume in Nifty Bank futures expanded by a comparable margin, lending the move institutional credibility that purely speculative positioning could not have sustained.
Midcap names offered sharper, more granular lessons. A large-cap IT stock, trading around ₹3,800 in early 2025, staged a breakout above a descending trendline on a volume spike that coincided with a sizeable FII accumulation reported in the weekly DII/FII settlement data. The stock moved from ₹3,800 to over ₹4,500 in under eight weeks. Volume remained above average through the bulk of that advance and tapered only near the target zone, offering a textbook confirmation-to-exhaustion sequence.
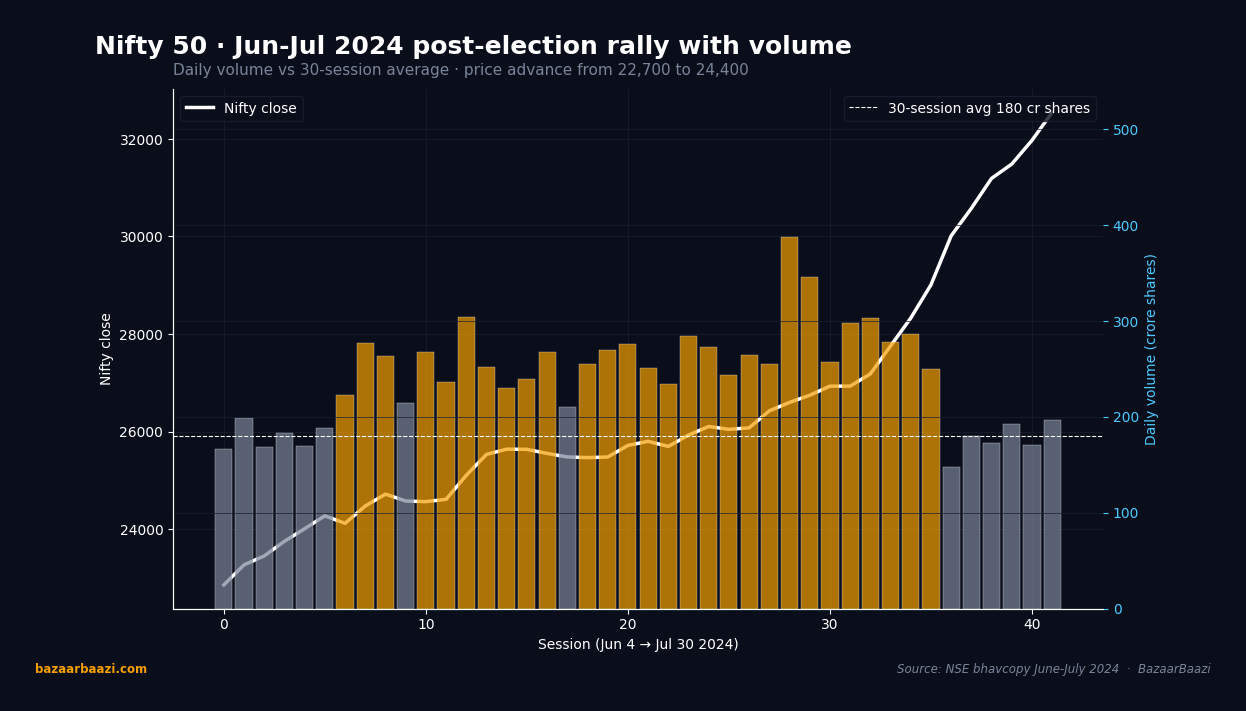
Chart 2. Nifty 50 post-election rally with daily volume, Jun-Jul 2024. The 6-week leg from approximately 22,700 to beyond 24,400 carried the signature the methodology describes. Daily volume sat above the 180 crore share 30-session baseline for 23 of the 42 sessions (55%), and exceeded 250 crore shares (the 1.5x threshold marked in gold) on 14 of those 23 sessions. The volume confirmation arrived from the second week of the rally onward, not at the breakout itself, but the sustained 1.5x-plus reading was what separated this leg from earlier failed attempts to clear the 23,000 zone.
Where Volume Lied
The methodology, for all its utility, generated its share of false signals.
In the first half of 2025, a midcap infrastructure stock broke out of a consolidation on what appeared to be healthy volume. The move, however, coincided with a block deal window and a handful of large-lot transactions that inflated the daily volume figure well beyond its baseline. Retail traders who interpreted the breakout as volume-confirmed entered long positions, only to watch the stock give back the entire move within four sessions once the block deal-related liquidity dried up. The lesson was specific: not all volume spikes carry organic conviction. Block deals, offer-for-sale windows, and derivative expiry rebalancing could create volume spikes that had no directional follow-through.
A similar trap appeared in the options market. During the March 2026 expiry cycle, OI in a Nifty 50 call strike built aggressively, and the underlying index moved sharply on expiry day on elevated futures volume. The move reversed within hours, as the OI unwind that followed the expiry crushed the very liquidity that had powered the intraday breakout. Traders who used futures volume alone as their confirmation metric got caught on the wrong side of a mean-reversion that played out in a single session.
These episodes pointed to a consistent error: treating volume as a binary signal rather than a layered one. Confirmation was strongest when equity delivery volume, F&O volume, and OI change all pointed in the same direction. When only one leg of that triad lit up, the signal weakened materially.
Base Rate Thinking
Across the two-year sample, a rough pattern emerged from tracking volume-confirmed breakouts versus unconfirmed breakouts in the top 50 F&O names.
Breakouts above resistance accompanied by volume at least 1.5 times the 20-session average, and sustained for three or more sessions, had a higher probability of holding for at least a 1:2 risk-reward target compared to breakouts on below-average volume. The edge was not enormous, and it varied by sector, but it was consistent enough to warrant inclusion in a systematic framework.
Conversely, breakdowns below support on high volume had a mixed track record, partly because bearish volume signals in Indian markets often coincided with broader FII selling that reversed quickly when domestic flows stepped in. The asymmetry suggested that volume confirmation worked better as a long-bias filter than a short-bias filter within the Indian context.
Chart 3 below illustrates how these dynamics played out at the intraday level, using a 30-minute chart of Nifty 50 futures during a high-volume breakout session.
A Practical Playbook
For traders who wanted to operationalise volume confirmation, the following framework distilled the lessons from the two-year window.
First, define the baseline. Compute a 20-session average of total traded volume for the instrument in question. Any session that printed volume above 1.5 times that average qualified as a "volume event." Second, layer the confirmation. A volume event at a key technical level, such as a breakout above resistance or a breakdown below support, carried more weight than a volume event in the middle of a range. Third, cross-check across buckets. Equity delivery volume confirming what F&O volume was suggesting reduced the false-signal rate considerably. Fourth, set exits mechanically. If volume confirmed the breakout, the initial target was a 1:2 risk-reward from the entry. If volume tapered below the 20-session average within three sessions of the breakout, the position warranted a partial exit regardless of price.
The framework was not a guarantee. It was an edge, probabilistic and imperfect, that tilted the odds in the trader's favour across a sufficient sample of trades.
VERDICT
Stance: NEUTRAL (methodological, not directional) Horizon: 1mo to 3mo (applicable across any rolling window) Rationale: Volume confirmation remained a useful but incomplete filter over the trailing two years. It added credibility to breakouts when multiple volume buckets aligned, but generated material false signals during block-deal windows, derivative expiry days, and FII-flow reversals. The edge existed; it simply required layered confirmation and disciplined exits to be captured.