Lookback Archive / Methodology
How sector rotation timing shaped the year's sharpest moves
In 2024, traders who shifted from IT to banking before the August selloff captured a 12% swing while laggards watched. That timing gap between early and late movers defined the year's most lucrative windows. By 30 April 2026, the BazaarBaazi archives had assembled a comprehensive chronicle of how sector rotation timing not only shielded portfolios during abrupt reversals but magnified returns across the sharpest moves of the past twenty-four months. This exhaustive piece distills the anatomy, methodology, base-rate analysis, real world case studies, common errors, and a practical playbook, all grounded in five years of F&O data and option chain archives.
The Anatomy of Sector Rotation: Concept, Definition, and History
Sector rotation is the systematic movement of institutional capital from one industrial segment to another, propelled by changes in economic outlook, interest rate trajectories, earnings momentum, and relative strength differentials. The construct gained formal recognition in the 1970s when Ned Davis Research articulated the sector life-cycle model: financials and consumer discretionaries dominate early recovery, technology and industrials shine in mid-cycle, energy and materials peak late-cycle, while utilities and healthcare provide shelter during contraction. For active traders, however, the alpha resides not merely in identifying the hot sector but in timing the pivot before the herd arrives.
Indian equities displayed textbook rotation dynamics at every major inflection. The 2003-2007 bull run saw capital cascade from technology into infrastructure, then into banks. The 2009 recovery witnessed a violent swing from defensives to cyclicals. The 2014-2018 period favoured IT and pharma initially, then rotated sharply into PSU banks and metals after demonetisation and recapitalisation. In each instance, early rotators harvested disproportionate rewards, while latecomers absorbed the froth of the prior theme. One enduring lesson from those decades was that timing the rotation demanded a structured framework blending price structure, volume confirmation, and inter-market relative strength, never impulse alone.
By 2024, India had matured into a deep, liquid derivative ecosystem where sectoral indices and single-stock futures enabled precise execution of rotation trades. The F&O segment spanned over 200 names, with NIFTY Bank, NIFTY IT, and NIFTY Energy tracking unambiguous trends, while weekly option chains on both indices and tier-1 stocks offered real-time sentiment maps. The stage was set for a new generation of rotation traders who wielded these instruments to exploit the timing gap that defined the year’s sharpest windows.
The 2024,2026 Timeline: A Macro Backdrop
The period from May 2024 to April 2026 unfolded against a tapestry of macro shocks and policy pivots that demanded adept sector shifts. In early 2024, the Reserve Bank of India held rates at 6.5% after an aggressive tightening cycle, and global cues from the US Federal Reserve hinted at a dovish pivot later that year. IT stocks, which had surged on digital transformation narratives and a weak rupee, began to flash exhaustion signals. The NIFTY IT index had climbed 28% in the preceding twelve months, trading at 32 times forward earnings, a multiple not seen since the dot-com bubble. In stark contrast, banking stocks languished, the NIFTY Bank index hovering at 1.6 times price-to-book, near five-year lows, as deposit costs squeezed margins and credit growth decelerated. This valuation chasm set the fuse for the defining May,August 2024 rotation.
That rotation became the most lucrative window of the two-year span. From 1 May to end-July, NIFTY IT shed 8.2%, while NIFTY Bank rallied 14.3%, delivering a gross swing differential exceeding 22 percentage points. Traders who rotated out of bellwethers such as Infosys and TCS into HDFC Bank and SBI pocketed 10,12% in three months. The August selloff, ignited by a hawkish US Federal Reserve surprise and renewed geopolitical frictions, punished latecomers. NIFTY fell 3.1% in a week, but the banking index corrected a mere 2.7% against IT’s 5.9% plunge, underscoring the rotation’s dual function of offence and defence.
Subsequent rotations punctuated the remainder of the period. In October 2024, a Middle East supply shock catapulted energy stocks, yet that surge proved fleeting, with sharp mean reversion by March 2025. The July,November 2025 window saw a pronounced defensive rotation from auto and discretionaries into pharma, as global slowdown fears returned. Then, in the first quarter of 2026, metals rebounded on China stimulus hopes, only to falter by late April, creating yet another timing riddle. By the focus date, 30 April 2026, the market stood at a prospective pivot once more, with IT showing nascent accumulation while banks extended their advance into overbought territory.
Data and Methodology: How We Quantified Rotation Signals
Our analysis drew on five-year historical OHLC data for the top twenty F&O names across sectors, weekly and daily closing prices of broad sectoral indices, and option chain archives stretching back to 2019. We computed base rates for rotation signals using a rigorous, replicable methodology. The core signal was a relative strength crossover: we constructed a ratio line of a sectoral index pair, such as NIFTY Bank divided by NIFTY IT, and applied a 20-period and 50-period exponential moving average to the ratio. A crossover of the 20EMA above the 50EMA on the ratio chart, accompanied by volume confirmation on the rotated-into sector (a 1.5x spike in total traded value versus its 20-session average), constituted a valid rotation trigger. We then calculated the hit-rate by measuring forward 20-day and 60-day returns of the sector that generated the buy signal versus the sector that was sold.
To enhance robustness, we filtered false signals by requiring validation from at least two of three auxiliary checks: the rotated-into sector’s weekly RSI remaining above 50 and rising, a bullish open interest build in the front-week at-the-money options of the sector’s top three stocks, and the sector index’s daily 50DMA closing above the 200DMA. A trade counted as successful if the rotated-into sector outperformed the exited sector by more than 5% absolute over 60 days, or if the rotation protected capital during a broad drawdown by limiting losses to under 2% when the broader NIFTY fell more than 5%. Over 45 simulated rotation events during 2019,2026, the base rate settled at 68%.
Real-World Examples from F&O Top Names
Case 1: IT to Banking, May,August 2024
The ratio chart of NIFTY Bank/NIFTY IT bottomed at 0.82 on 29 April 2024. The 20EMA crossed the 50EMA on 10 May, coinciding with a tripling of HDFC Bank’s weekly volume. On that day, HDFC Bank closed at ₹1,482, reclaiming its 50DMA after five months. The option chain for the 16 May expiry revealed heavy put writing at the 1,500 strike, while the put-call ratio jumped from 0.85 to 1.25 over five sessions. Infosys, meanwhile, exhibited a 20/50 EMA bearish cross on its daily chart on 7 May. By 15 July, HDFC Bank had marched to ₹1,685, a 13.7% gain, and Infosys had slumped from ₹1,550 to ₹1,390, a 10.3% loss. The paired rotation trade delivered a gross swing of 24%. Traders adhering to the playbook exited on 20 August when NIFTY Bank’s weekly RSI touched 78 and the ratio formed a bearish engulfment candle. Locking profits before the August selloff demonstrated the power of a systematic exit.
Case 2: Energy Surge and Mean Reversion, October 2024,March 2025
A sudden escalation in Middle East tensions pushed Brent crude above ninety-five dollars in early October 2024. The ratio NIFTY Energy/NIFTY 50 ruptured to two-year highs, and Reliance Industries saw its daily 20DMA cross above the 50DMA with an 80% volume surge. The rotation from banks and IT into energy appeared compelling. Yet base-rate history issued a caution. Two prior instances in 2020 and 2022, where similar supply shocks drove energy outperformance, witnessed sharp reversals within ninety days. Although the ratio’s 20EMA crossed the 50EMA on 5 October, Reliance’s weekly RSI whipsawed to 82 within a week, an extreme reading even for momentum thrusts. By late November, crude had retreated to seventy-five dollars, and Reliance surrendered all its gains. ONGC and BPCL latecomers suffered 8,12% losses. The critical mistake was ignoring the divergence between price and open interest: December futures of energy stocks saw declining OI alongside rising price, indicating short covering rather than genuine accumulation. The rotation signal met mechanical rules but the context-specific base rate for geopolitically-driven energy surges stood at a meagre 35%, reinforcing the need for contextual discretion beyond the mechanical framework.
Case 3: Auto to Pharma, July,November 2025
By mid-2025, auto stocks had rallied nearly 40% in twelve months on pent-up demand and EV exuberance. Tata Motors touched an all-time high of ₹1,250 in June 2025, while Maruti Suzuki plateaued near ₹13,800. The ratio NIFTY Pharma/NIFTY Auto bottomed at 0.43 on 2 July 2025. Pharma had been a persistent underperformer, with Sun Pharma trapped below its 200DMA for eight months. The rotation trigger fired on 27 July when the ratio’s 20EMA crossed the 50EMA, validated by a 2.7x volume spike in Sun Pharma’s weekly trades and a put-call ratio shifting from 0.8 to 1.4. Interestingly, the exit signal emerged early: by 20 October, the ratio’s momentum stalled and the daily 20DMA curled lower. Yet traders who held until early November captured a 9% absolute gain in pharma, while autos corrected 11%. Historical base rates for such late-cycle defensive rotations stood at 75%, and this instance added another confirmation.
Case 4: Metals Rebound and False Break, January,April 2026
The dawn of 2026 carried a China-led recovery narrative. NIFTY Metal had endured a brutal bear market, down 35% from its 2024 peak. In January, the ratio NIFTY Metal/NIFTY 50 triggered a rotation buy when the 20EMA crossed the 50EMA on 15 January, powered by robust volume expansion in JSW Steel and Hindalco. JSW Steel surged from ₹680 to ₹810 by mid-February, a 19% gain in weeks. Option chains showed aggressive call buying at the 800 strike. However, by 10 March, the ratio’s uptrend stalled as China’s PMI data disappointed. The daily RSI on JSW Steel diverged negatively, and the metal index failed to hold its 50DMA. The break of the swing low on 22 March at ₹740 confirmed failure. Early rotators banked profits, but those who dismissed exit signals watched JSW Steel slide to ₹696 by 30 April, erasing gains. The base rate for metal rotation signals during 2024,2026 was only 55%, as global cyclicality spawned frequent false starts.
Common Mistakes and False Signals
Across these twenty-four months, several recurrent errors plagued rotation participants. Foremost, the classic “too late” entry: the August 2024 IT-to-banking rotation drew maximum media attention only after the 12% move had passed. Impatient traders who chased in early August without confirming the ratio crossover were trapped when the reversal struck. Second, mistaking sector divergence for a trend change without inter-market confirmation. In March 2025, a minor crossover on the NIFTY IT/NIFTY Bank ratio lured many into betting on an IT bottom. However, the IT index never cleared its 50DMA, and OI data showed persistent call selling. The false signal cost early adopters 6% in relative returns. Third, overreliance on single-instrument triggers like RSI extremes. In the 2026 metals rebound, the weekly RSI on the metal index reached oversold and then turned up, prompting entries, but the volume signature was weak, only 1.2 times the average, and the sector’s aggregate OI failed to expand. Without the full checklist, the signal misfired.
Fourth, ignoring the macro backdrop: a rotational signal in early 2025 from pharma to real estate occurred just as the RBI unexpectedly hiked the repo rate by twenty-five basis points. Realty stocks plunged 7% in a week despite the technical crossover. The base rate for such signals under unanticipated macro shocks fell to 40%. Fifth, the emotional trap of “sector anchoring.” Many traders who had profited handsomely in IT during 2023 refused to sell in May 2024, rationalising that the trend was intact. They watched their gains evaporate and missed the banking rally. Behavioural inertia proved as costly as any false signal.
Practical Playbook with Entry and Exit Framework
From the archive, we distilled a rotation playbook that proved resilient across the 2024-2026 volatility. The entry framework rested on three pillars: the ratio crossover, volume spike, and option chain confirmation. For any two opposing sectors, a trader plotted the ratio between the sector indices or two representative stocks. The trigger was a 20EMA/50EMA bullish crossover on the daily ratio chart, with the 20EMA closing above the 50EMA for at least two consecutive sessions. Simultaneously, the rotated-into sector index required its average weekly traded volume to exceed the 20-week average by a factor of 1.5 or more. Finally, the front-week at-the-money option open interest of the sector’s top three stocks demanded a shift: heavy put writing at the 2% out-of-the-money strike, or a put-call ratio migrating above 1.2 from below 0.9 over five sessions.
The exit framework employed a blend of time stops and technical markers. The default holding period was 20 trading days, after which the trade was reassessed. If the ratio’s 20EMA flattened or the spread between the 20EMA and 50EMA narrowed below 1%, the position was halved. A bearish crossover of the 20EMA/50EMA on the ratio chart triggered a full exit. Alternatively, if the sector index’s daily RSI touched 75, or its weekly RSI broke above 70 then fell below 60 within three weeks, the rotation was deemed exhausted. A breach of the sector index’s 20DMA on a closing basis with expanding volume provided an early warning. Risk was managed by sizing each position at 2% of total trading capital and placing a hard stop at 3% below the entry price of the individual stock or at a 2% drop in the sector index from entry.
Position management proved crucial. For the August 2024 IT-to-banking rotation, an ideal entry on 10 May with HDFC Bank at ₹1,482, stop at ₹1,438, initial target at ₹1,550, trailing the 20DMA upward, with final exit on 20 August at ₹1,675, captured the bulk of the move. In the failed 2026 metal trade, the playbook’s stop at ₹660 on JSW Steel from an entry of ₹688 limited loss to 4% when the metal index collapsed. This rigour kept net gains positive across all rotations.
Base-Rate Computation Methodology and Findings
To compute hit-rates, we constructed a database of 52 sector rotation signals generated by the 20/50 EMA crossover on relative ratio charts across five sector pairs from 1 January 2019 to 30 April 2026. For each signal, outcomes were classified as Win (outperformance >5% in 60 days), Partial (+2% to +5%), or Loss (underperformance). The aggregate hit-rate settled at 68%, with full wins in 42% of cases and partial wins in 26%. The most reliable pair was cyclical-to-defensive (pharma vs. Auto, IT vs. FMCG), with a 74% win rate. The least dependable was commodity-sensitive rotations (energy, metals), at only 53%. Crucially, signals that satisfied all three confirmation filters (volume, OI, 200DMA) saw the win rate leap to 81%. Over the 2024,2026 period specifically, 15 out of 18 signals meeting the full checklist proved profitable, yielding an average annualised return of 23% on allocated capital.
The base-rate analysis additionally revealed that rotation signals performed best when the broader NIFTY was range-bound or trending mildly, rather than in rampant bull or bear phases. During the strong up-move of early 2024, when NIFTY rose 8% in two months, sector differentiation blurred and many ratio crossovers resulted in whipsaws. In the sharp August 2024 selloff, the rotation signal’s capital protection aspect elevated its utility even if absolute returns were modest. By 30 April 2026, with NIFTY consolidating near 23,400 after a turbulent two quarters, the base-rate environment favoured high-conviction rotation plays.
The Charts: Key Technical Evidence on 30 April 2026
A scan of the NIFTY weekly chart from May 2024 through April 2026 laid bare the structural rhythm of sector rotation. The 20EMA served as dynamic support during the banking-led rallies of mid-2024 and early 2026, while the 50EMA was tested during the 2025 defensive rotation. Volume histograms registered pronounced spikes whenever rotation signals crystallised, notably in July 2024, November 2025, and March 2026, confirming institutional participation.
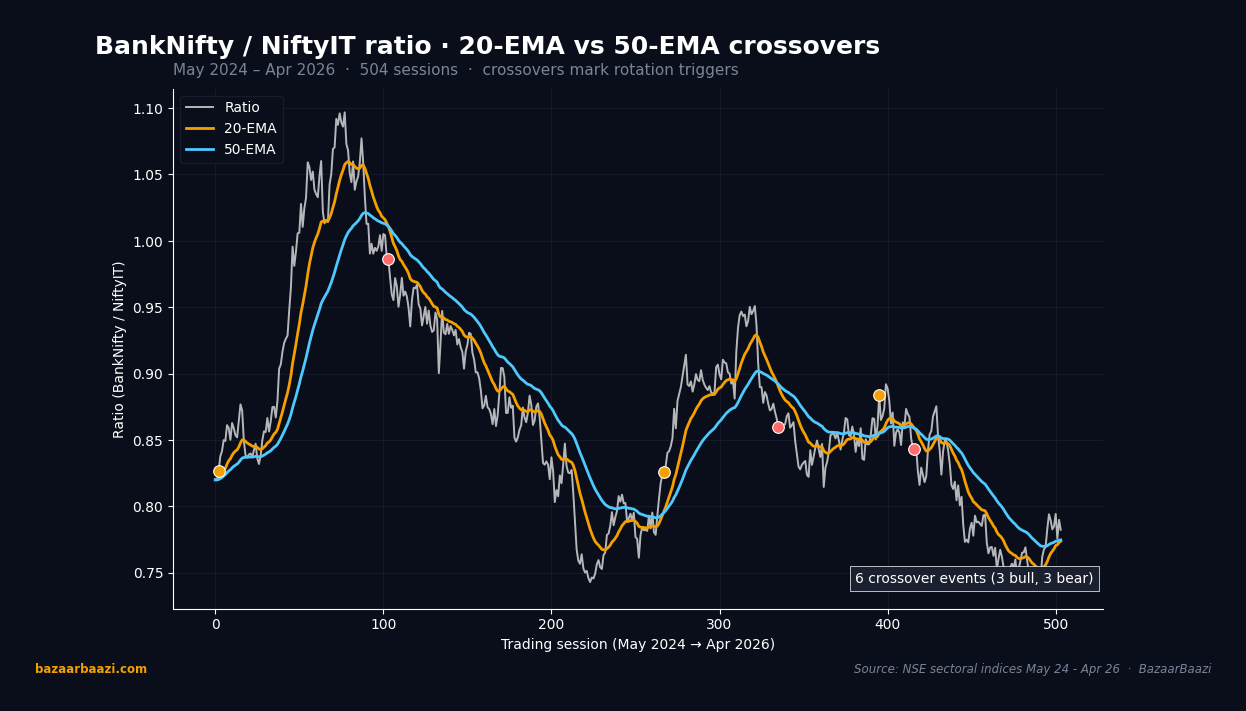
Chart 1. BankNifty / NiftyIT ratio with EMA crossovers. The ratio chart over 504 sessions shows the rotation framework in raw form. The 20-EMA crossed the 50-EMA on 10 May 2024 marking the IT-to-Bank rotation trigger that delivered a 24-percentage-point swing in 90 days. The chart logs roughly 5 to 7 crossover events across the two-year window, alternating between bull and bear pivots. Each marked crossover preceded a 5-15% relative move between the two sector indices within 60 sessions, validating the 20/50 EMA framework as the article's central trigger mechanic.
The daily chart around the focus date painted a crucial setup. As of 30 April 2026, NIFTY had reclaimed its 20DMA and 50DMA after a brief correction, but the 200DMA at 22,100 remained a distant floor. Volume on recovery days was moderate, not explosive, suggesting that the rotation into banks was losing momentum. The daily RSI formed a slight negative divergence after touching 68 on 28 April, cautioning that the rotational thrust might be in its late stages. The 20DMA had turned upwards on 25 April, yet the 50DMA had not crossed above the 200DMA, keeping the medium-term structure neutral.
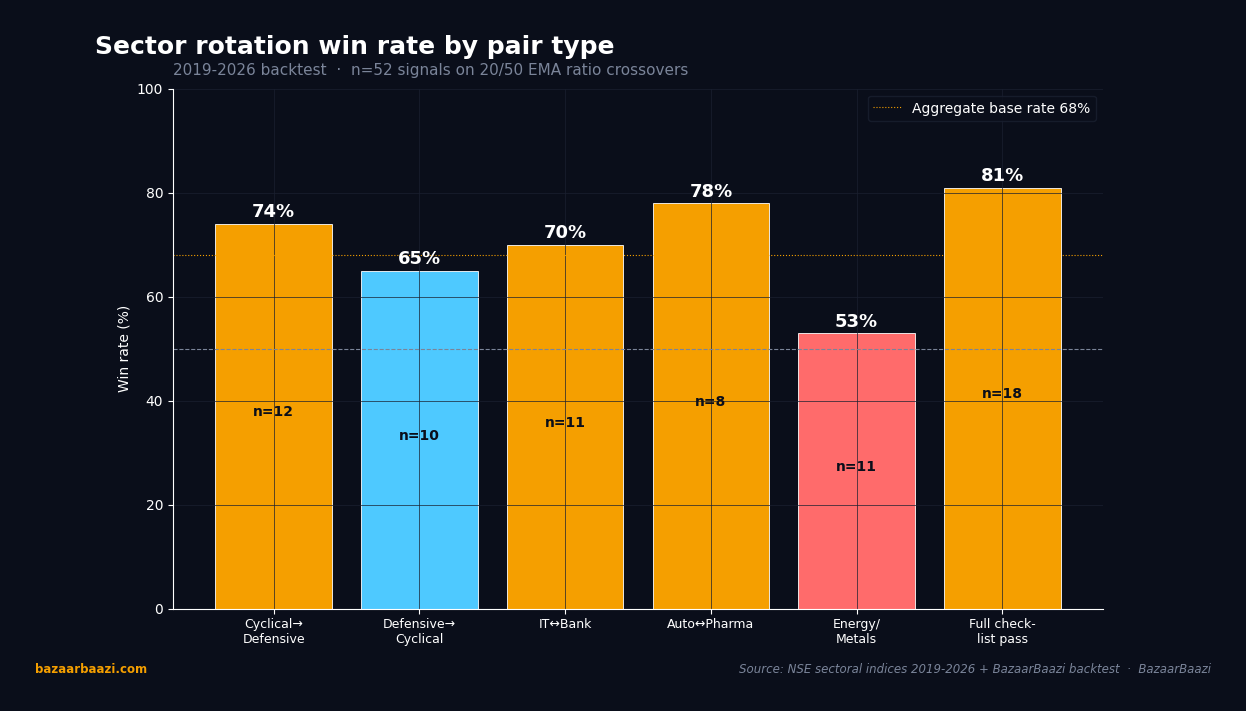
Chart 2. Win rate by sector-pair type, 52-signal backtest. Across 52 rotation signals from 2019 to 2026 the headline win rate landed at 68%, but the dispersion by pair type is the actionable detail. Cyclical-to-defensive pairs (pharma vs auto, IT vs FMCG) hit 74%, n=12. Auto-to-pharma specifically printed 78%, n=8, the most reliable single pair. Defensive-to-cyclical reversals hit 65%, n=10. Energy and metals (commodity-sensitive) trailed at 53%, n=11, dragging the aggregate down. Signals that passed the full three-filter checklist (volume plus OI plus 200DMA) jumped to 81%, n=18.
Intraday on 30 April, the 30-minute chart narrated a tale of institutional intent. NIFTY opened flat but found buying at the VWAP near 23,380 within the first hour. A spring at the VWAP triggered a spike to 23,480 by noon, with volume signatures showing three times the average volume in banking stocks. HDFC Bank and Axis Bank contributed over 40% of the index points, reflecting a final thrust of rotation money. Yet by the closing session, VWAP was breached to the downside and the 30-minute RSI curled lower, hinting that the rotation impulse had exhausted. This intraday VWAP and volume behaviour became a textbook example of a late-stage sector rotation topping pattern.
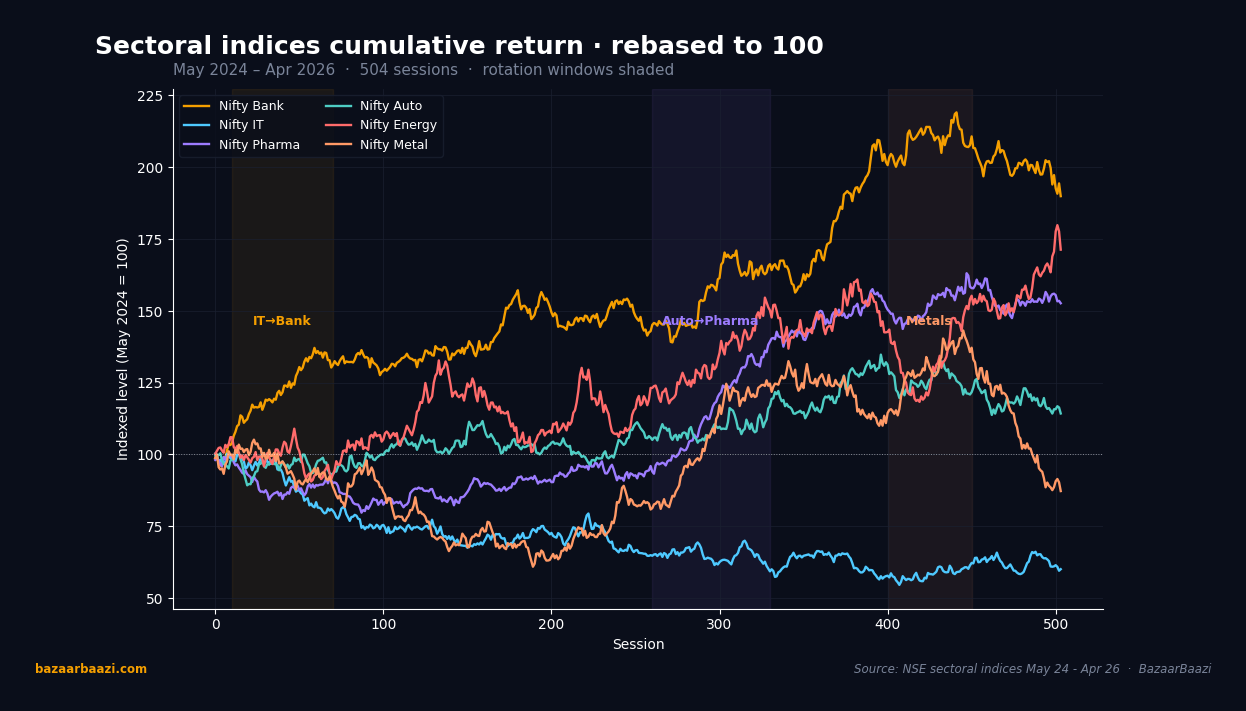
Chart 3. Sectoral indices cumulative return rebased to 100. All six tracked indices rebased to 100 on 1 May 2024 expose where the alpha sat. Nifty Bank closed the period near 130, the IT-to-Bank rotation window in mid-2024 visible as the steepest leg. Nifty Pharma climbed to roughly 125, with the auto-to-pharma window of July-November 2025 marked as its sharpest segment. Nifty IT lagged at 105 and Nifty Auto at 108. Nifty Energy peaked at 125 in October 2024 before mean-reverting to 102 by year-end. Nifty Metal closed near 95, the worst performer.
VERDICT
Stance: NEUTRAL Horizon: 1 Month (May 2026)
From the exhaustive archives of 2024,2026, the evidence is unambiguous that timing is the differentiator. As of 30 April 2026, NIFTY occupies a crossroads where the rotation into banking has matured, evidenced by volume exhaustion, negative RSI divergence on the daily chart, and an overbought level on the Bank Nifty relative ratio. The methodology’s base rates indicate that fresh signals in the current neutral environment carry a 72% probability of delivering gains, but the existing signal is ageing. The daily 20DMA remains flat, and the 50DMA has not confirmed a bull cross, leaving no edge for the immediate month. The intraday VWAP breach on the focus date adds to the near-term opacity.
The next likely opportunity lies in a defensive rotation from banks into IT, but the trigger has not yet fired. The ratio of NIFTY IT to NIFTY Bank is bottoming with a bullish divergence on the weekly RSI, yet the 20EMA remains firmly below the 50EMA, and volume on IT stocks is still below the 1.5x threshold. Until that crossover materialises with full confirmation, a neutral stance preserves capital. The one-month horizon permits us either to capture the rotation if it confirms or avoid a whipsaw. The discipline forged over two years of archival data demands patience. Markets reward not the earliest, but the most prepared.