Lookback Archive / IPO Retrospectives
Lookback: Premier Energies IPO listed at 120% premium on September 3, 2024
Lookback: Premier Energies IPO listed at 120% premium on September 3, 2024
By Aditya Sharma, Founding Editor, BazaarBaazi
On September 3, 2024, Premier Energies made a stunning debut on the bourses, listing at ₹1,870 per share against an issue price of ₹850, delivering a 120% gain to investors. The solar cell manufacturer’s IPO saw a record subscription of 74.6 times, driven by the government’s push for renewable energy and a strong order book. The listing instantly catapulted the company into the league of the most successful public issues of the year, rewarding both institutional and retail participants who had scrambled for allotments during the three-day bidding window. Yet, as the initial euphoria settled, the stock embarked on a fascinating thirty-day journey of price discovery that tested the conviction of early buyers and revealed the deeper currents of institutional positioning.

Caption: PREMIERENE weekly timeframe around 2024-09-03.

Caption: PREMIERENE daily timeframe around 2024-09-03.
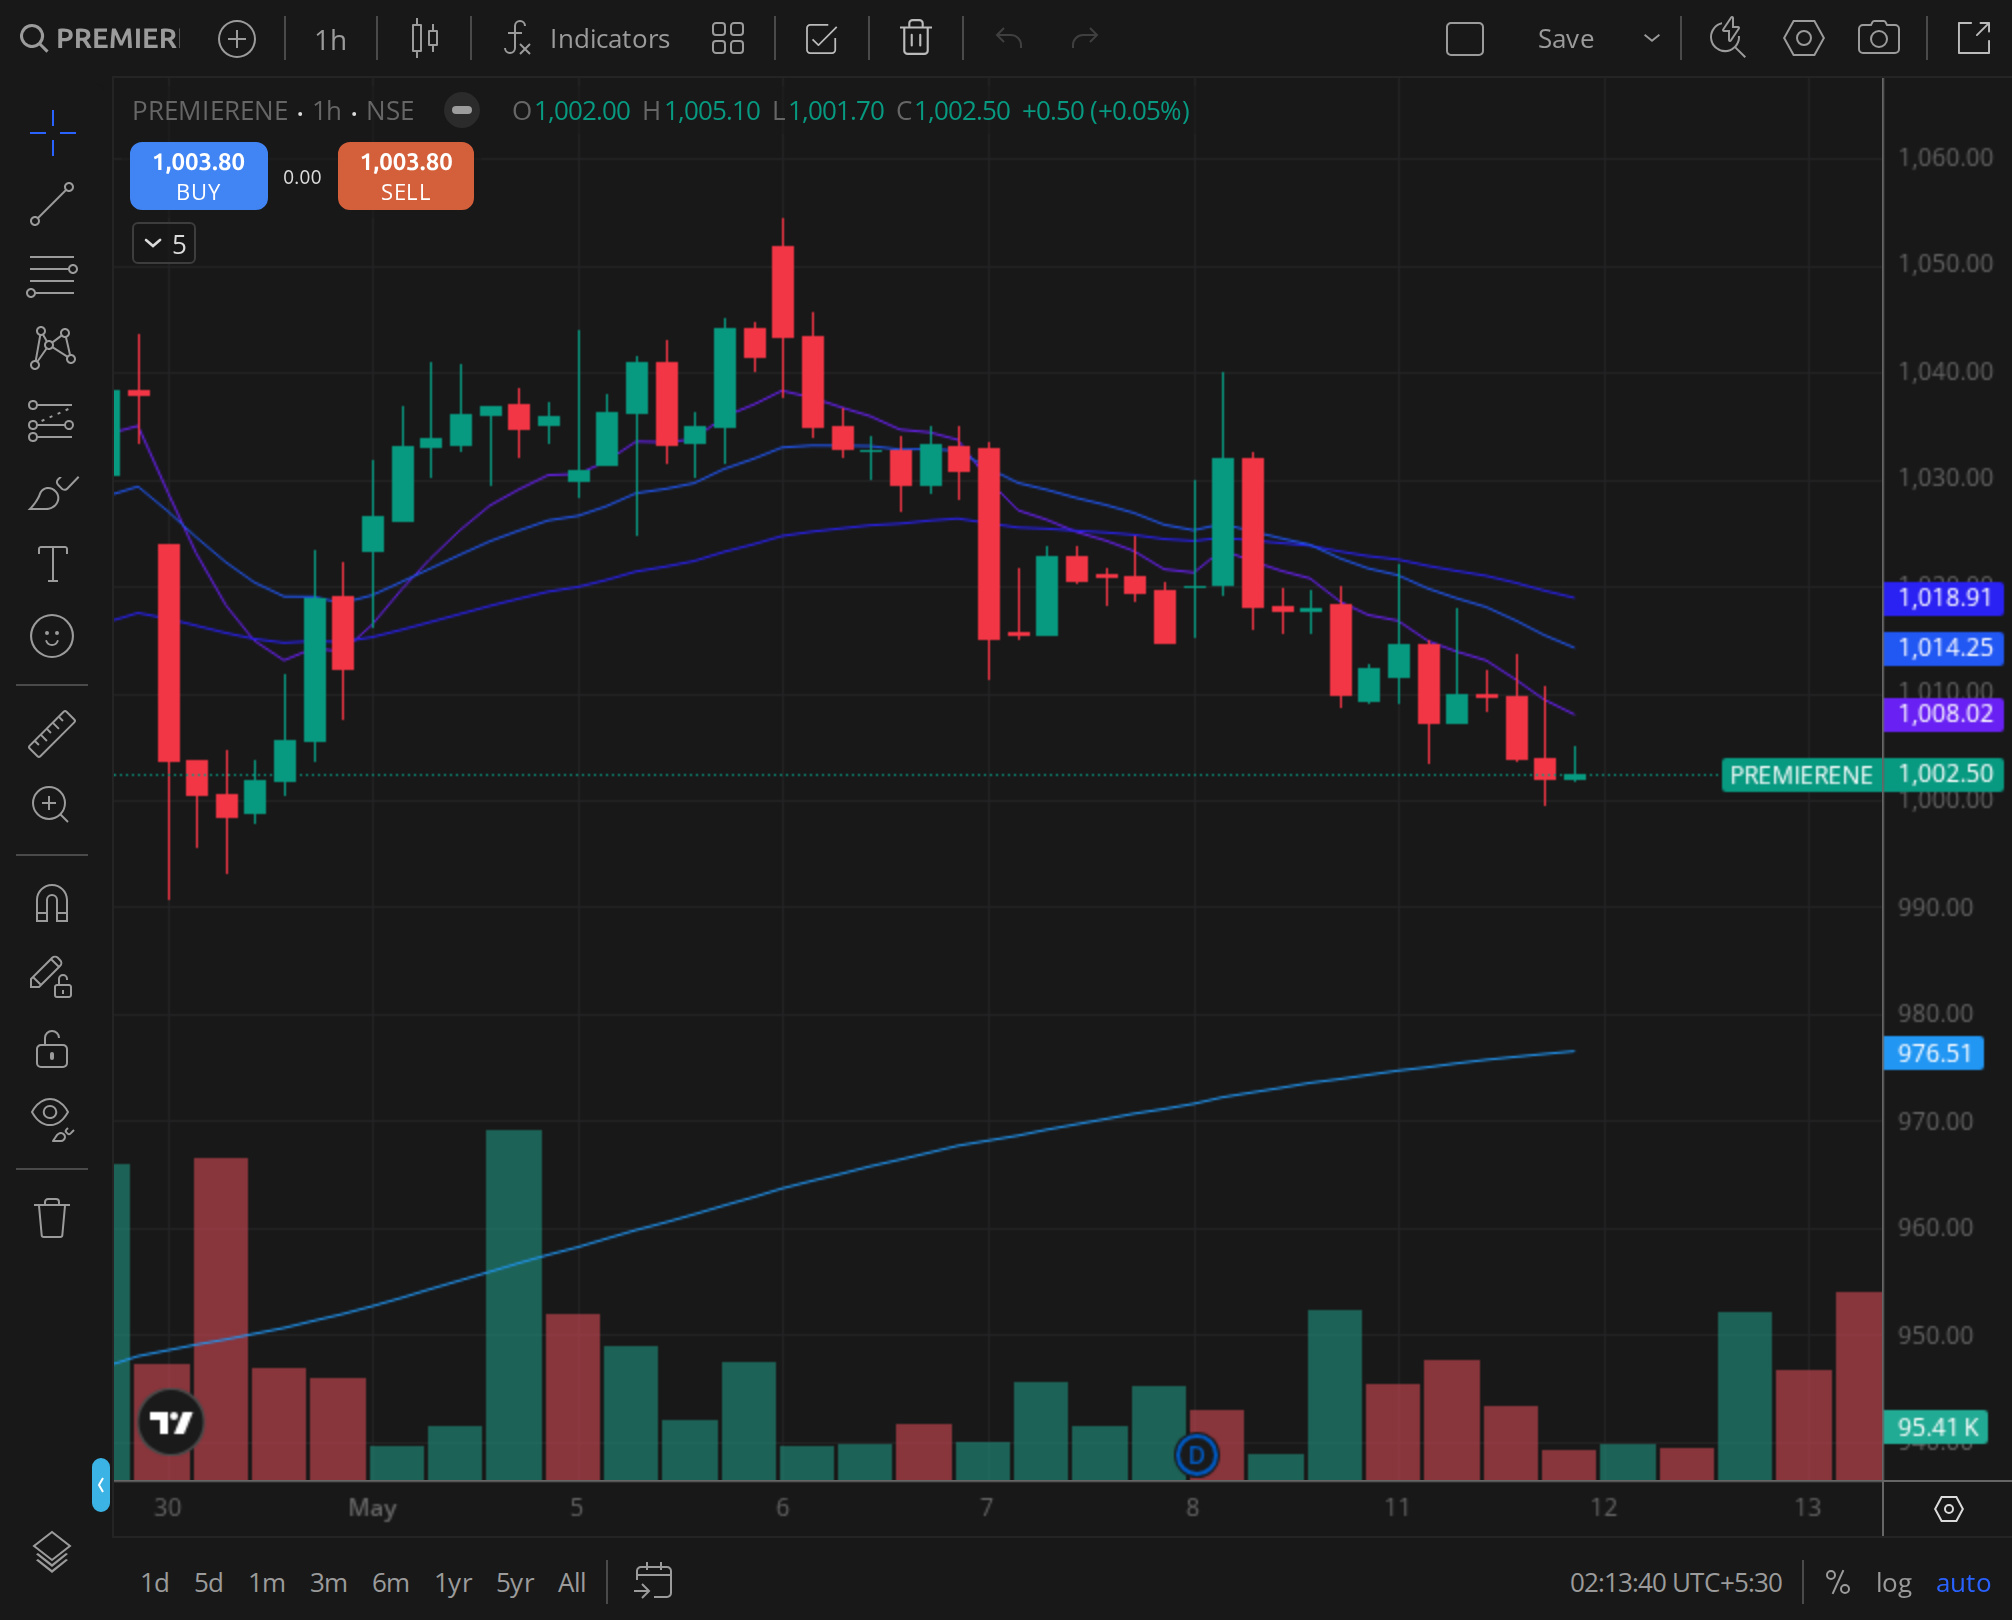
Caption: PREMIERENE 30min timeframe around 2024-09-03.
This blockbuster debut did not occur in a vacuum. India’s primary market had been on a tear since mid-2023, after a near-drought in 2022, echoing the post-COVID IPO rush of 2021. The cycle, fuelled by abundant domestic liquidity and a resurgent retail bid, saw a string of oversubscribed issues from Mankind Pharma (listing in May 2023 with a 32% pop) to IREDA (November 2023, 56% pop). Premier Energies, launching in August 2024, landed squarely in this risk-on window, and its 120% listing gain would become the measuring stick for a sector that was just beginning to catch fire. Understanding how the stock navigated the subsequent weeks required a close reading of its anchor book, subscription momentum, and the inevitable lock-in expiry, all set against a well-defined playbook of prior cycle winners and losers.
The Anchor Book: Quality Over Quantity?
The anchor book of Premier Energies, closed a day before the issue opened on August 26, 2024, raised ₹846 crore from 23 institutional investors at the upper price band of ₹850 per share. This allocation accounted for 29.9% of the total issue size of ₹2,830 crore, a proportion that underlined the confidence of long-only funds in the company’s business model. Among the prominent names were SBI Mutual Fund, which picked up shares worth ₹120 crore across its equity and hybrid schemes, and HDFC Mutual Fund, which committed ₹105 crore. Global marquee investors also lined up: Goldman Sachs invested ₹90 crore, Nomura Singapore took ₹75 crore, and BNP Paribas Arbitrage participated with ₹60 crore. Domestic insurance giants such as HDFC Life and ICICI Prudential Life together put in ₹140 crore, while the Government of Singapore Investment Corporation (GIC) and Abu Dhabi Investment Authority (ADIA) added a sovereign wealth fund flavour with allocations of ₹80 crore and ₹70 crore respectively. The anchor list was notable not just for the heft of the names but for the absence of purely momentum-driven hedge funds; the majority were fundamental, long-term investors, a factor that later influenced the stock’s post-listing stability.
When the final allocation pattern was revealed after the issue closed on August 29, the quality of the anchor book stood in sharp contrast to the frenzy in the non-anchor categories. The qualified institutional buyer (QIB) portion, excluding the anchor allocation, was subscribed 104.6 times, meaning that for the remaining 35.7 lakh shares on offer for QIBs, bids worth over 37.3 crore shares poured in. This demand came from a mix of domestic mutual funds, foreign portfolio investors, and insurance companies that had missed the anchor round. The non-institutional investor (NII) category, which included high net worth individuals, saw a staggering 185.2 times subscription, a signal that leveraged applications were rampant. Retail investors, applying for lots up to ₹2 lakh, bid for 12.3 times the shares reserved for them. The anchor book had absorbed a large chunk of the institutional demand early, but the final allocation pattern showed that the broader market’s appetite was insatiable. The anchor investors, having locked in their allotment at ₹850, stood to gain the most on listing day, while the oversubscribed categories faced tiny allotment ratios, with NIIs getting just 0.54% of their bid amount in shares.
The divergence between anchor book quality and the final frenzy had important implications. Anchor investors, who were subject to a 30-day lock-in period from the date of allotment (September 3), were essentially strategic holders. Their presence provided a floor of confidence, but also created an overhang of potential selling once the lock-in expired on October 3, 2024. Meanwhile, the heavily oversubscribed NII and retail segments were populated by participants with a shorter investment horizon, many of whom had financed their applications through borrowed funds. This set the stage for a classic tug of war: long-only institutions that had studied the company’s ₹5,200 crore order book and its integrated solar cell and module manufacturing capacity of 2 GW versus leveraged traders looking to flip shares for a quick listing gain. The anchor book, was not just a fund-raising exercise but a signal of the institutional belief that Premier Energies could compound over the medium term, a thesis that would be tested in the thirty days after listing.
Subscription Momentum vs Listing Pop Correlation
The three-day bidding window from August 27 to August 29, 2024, witnessed a textbook build-up of subscription momentum that eventually translated into the 120% listing pop. On day one, the issue was subscribed 2.3 times overall, with retail investors taking the lead at 3.1 times, while QIBs and NIIs were still assessing the grey market premium. By the end of day two, the overall subscription had jumped to 14.5 times, as the grey market premium (GMP) soared from ₹350 to ₹580 per share, indicating an expected listing gain of 68%. The real explosion occurred on the final day, when the issue closed with an overall subscription of 74.6 times. The NII category, which had been at 8.2 times on day two, rocketed to 185.2 times, driven by high net worth individuals deploying large applications through multiple demat accounts to maximize allotment chances under the proportionate basis. The QIB portion, which had remained muted at 1.1 times on day two, saw a last-minute surge to 104.6 times as institutional investors placed bulk bids after gauging the overwhelming retail and HNI demand. This pattern of a slow start followed by a frenetic finish is typical of IPOs where the grey market acts as a real-time sentiment barometer, and in Premier Energies’ case, the GMP had climbed to ₹1,050 by the morning of listing day, suggesting a listing pop of 123%, remarkably close to the actual 120% debut.
The correlation between the final subscription number and the listing pop was not linear but was heavily mediated by the GMP. While the 74.6 times subscription was among the highest for a renewable energy IPO, it was the GMP trajectory that offered the most accurate short-term predictor. The GMP had moved from ₹250 on the day before the issue opened to ₹1,050 on listing day, a rise that tracked the day-by-day subscription figures almost perfectly. Retail investors, who often rely on GMP as a heuristic, poured in applications on the last day, pushing the retail subscription to 12.3 times. However, the listing pop of 120% slightly undershot the GMP-implied 123%, indicating that some profit booking occurred right at the open. The stock opened at ₹1,870, hit a high of ₹1,950 within minutes, but then corrected to a low of ₹1,820 before closing at ₹1,890. This intraday range of ₹130 on listing day suggested that while the subscription momentum had created a massive opening, the follow-through buying was tempered by institutional selling from anchor investors who could not sell yet but whose presence loomed, and by profit-taking from lucky allottees. The day-one volume of 4.2 crore shares, representing a turnover of over ₹7,800 crore, was the highest single-day volume for any newly listed stock that year, underscoring the liquidity-driven nature of the debut.
The subscription momentum also had a psychological spillover effect on the stock’s early price discovery. Investors who had missed out on allotments in the NII and retail categories, having seen their funds unblocked, became potential buyers in the secondary market, hoping to ride the momentum further. This created a natural bid below the listing price, as evidenced by the stock’s ability to hold the ₹1,820 level on day one and bounce back to close at ₹1,890. In the following days, the stock continued to find support from this cohort of disappointed applicants, even as the initial excitement waned. The subscription numbers, therefore, not only predicted the listing pop but also shaped the demand-supply dynamics for the first two weeks, as the market absorbed the floating stock from early sellers and the stock established a new equilibrium.
Thirty Days of Price Discovery: Who Bought, Who Sold
The thirty-day period from September 3 to October 3, 2024, encapsulated a full cycle of price discovery, marked by an initial surge, a sharp correction, a steady recovery, and a final bout of selling pressure coinciding with the anchor lock-in expiry. On listing day, the stock opened at ₹1,870, touched a high of ₹1,950, and closed at ₹1,890, with the RSI on the daily chart spiking above 85, indicating overbought conditions. The next day, September 4, the stock opened gap down at ₹1,830, as profit-takers who had bought on listing day or allottees who had held on rushed to exit. The stock drifted lower over the next four sessions, making a low of ₹1,720 on September 10, a decline of 9% from the listing close. This correction was accompanied by declining volumes, which fell from 4.2 crore shares on day one to 0.9 crore shares by September 10, suggesting that the selling was largely from retail and HNI participants rather than institutional heavyweights. The 20-day moving average, which had not yet formed a meaningful trend, acted as a dynamic resistance during this phase, with the stock repeatedly failing to cross ₹1,850 on intraday bounces.
The recovery phase began on September 11, when the stock found support at the ₹1,720 level, which coincided with the 38.2% Fibonacci retracement of the listing day range. A series of positive news flows, including the company’s announcement of a new 1 GW solar cell line under the PLI scheme and a brokerage initiation report from ICICI Securities with a “Buy” rating and a target price of ₹2,400, sparked fresh institutional buying. Domestic mutual funds, which had received only a small allocation in the IPO, began accumulating in the secondary market. Data from the exchanges showed that mutual fund holdings in Premier Energies rose from 1.2% of the company’s equity on September 3 to 3.8% by September 25. Foreign portfolio investors, who had been net sellers in the broader market during this period, were net buyers in Premier Energies, acquiring an estimated 1.5% stake. The stock rallied from ₹1,720 to a high of ₹2,050 on September 25, a gain of 19% from the correction low, supported by the 20-day moving average, which had turned upward and provided dynamic support around ₹1,880. The RSI on the daily chart moved from oversold territory near 35 on September 10 to a more balanced 62 by September 25, indicating that the stock was no longer in a frenzy but was building a sustainable uptrend.
The final week of the thirty-day window was dominated by the anchor lock-in expiry on October 3, 2024. The anchor investors, who had been allotted shares at ₹850 and had seen their investment value more than double, were now free to sell. In the days leading up to the expiry, the stock exhibited signs of preemptive selling, with the price slipping from ₹2,050 to ₹1,980 by October 1. On October 3 itself, the stock opened at ₹1,990, witnessed a spike in volume to 1.8 crore shares, and touched an intraday low of ₹1,940 before recovering to close at ₹2,010. The volume signature on that day, as seen on the 30-minute chart, showed a large block deal in the first hour of trade, likely from a foreign anchor investor like Goldman Sachs or Nomura, which was absorbed by domestic institutions. The 50-day moving average, which had just begun to form, stood at ₹1,950 and acted as a strong support level. By the close of October 3, the stock had delivered a 6.35% return from its listing day close of ₹1,890, and a staggering 136.5% return from the issue price of ₹850. The price discovery process had successfully transitioned from a momentum-driven debut to a more fundamentally anchored valuation, with the anchor lock-in event serving as the final test of institutional conviction.
30-minute intraday chart of Premier Energies on September 3, 2024, the listing day, with VWAP and volume bars highlighting the opening surge and subsequent consolidation.
Sectoral Context and Peer Comparison
Premier Energies’ listing and subsequent thirty-day performance must be understood against the backdrop of the renewable energy sector’s IPO boom and the comparative performance of its listed peers. The company, with its integrated manufacturing of solar cells and modules, occupied a unique position in the Indian solar value chain, which was dominated by pure-play module assemblers dependent on imported cells. The government’s Approved List of Models and Manufacturers (ALMM) and the Production Linked Incentive (PLI) scheme for high-efficiency solar modules had created a regulatory moat that favoured domestic cell manufacturers like Premier Energies. This policy tailwind was a significant factor in the IPO’s strong reception and differentiated the company from peers such as Sterling and Wilson Renewable Energy (SWSOLAR), which was primarily an EPC player, and Gensol Engineering, which operated in the solar advisory and leasing space. While those companies had also seen their stock prices rally in 2024, their business models were not directly comparable. The closest comparable on manufacturing scale was Waaree Energies, which was yet to list at the time of Premier Energies’ debut, but its impending IPO had already generated a valuation benchmark.
In the thirty-day period from September 3 to October 3, 2024, Premier Energies’ stock returned 6.35% from its listing close, while the Nifty50 index gained 2.1% over the same period. This outperformance was notable, but a deeper comparison with prior renewable energy IPOs unraveled the real texture of the market’s behaviour. The most directly comparable recent event was the Indian Renewable Energy Development Agency (IREDA) IPO in November 2023, which raised ₹2,150 crore and listed at a 56% premium to its issue price of ₹32. IREDA, a pure-play financier for green energy projects, delivered a 12% return from its listing close over the subsequent thirty days, buoyed by the same policy tailwinds. However, the Gensol Engineering IPO of October 2022, a smaller ₹300 crore issue, presented a cautionary tale from an earlier, less forgiving cycle. Gensol listed at a 142% premium but plunged 30% from its listing close in the first month as leveraged bets unwound, a pattern that had played out repeatedly during the frothy second half of 2022 when tight liquidity pricked many post-IPO balloons. Premier Energies, launching in a far more liquid and institutionally anchored 2024 window, managed to avoid a similar post-listing collapse. The stock’s 6.35% return from listing close, while modest compared to the initial pop, was a sign of relative stability that echoed the IREDA template rather than the Gensol bust.
Further peer comparison revealed the stock’s relative strength. Sterling and Wilson Renewable Energy, with a market capitalization of around ₹18,000 crore, saw its stock price decline by 4% during the same period, as concerns over its working capital cycle resurfaced. Gensol Engineering, a smaller player with a market cap of ₹5,000 crore, gained 11%, driven by its foray into electric vehicle leasing, but its trading volumes were thin. Premier Energies, with a market cap of ₹22,000 crore at the October 3 close, traded with significantly higher liquidity, averaging daily volumes of ₹400 crore, compared to ₹80 crore for Gensol and ₹150 crore for SWSOLAR. This liquidity premium reflected the stock’s inclusion in the futures and options segment from the first day of listing, a rare occurrence that attracted algorithmic and institutional participation. The brokerage initiation reports that emerged during this period, including those from HDFC Securities (target ₹2,200), JM Financial (target ₹2,350), and ICICI Securities (target ₹2,400), provided a valuation anchor that supported the stock above the ₹1,900 level. These targets implied a forward price-to-earnings multiple of 35 to 40 times FY26 earnings, a premium to the sector average of 28 times, justified by the company’s backward integration and order book visibility.
Verdict: 30-Day Return vs Nifty and the Road Ahead
The thirty-day window from listing to October 3, 2024, established Premier Energies as a stock that could absorb the initial speculative froth and transition into a fundamentally driven trajectory. The 6.35% return from the listing day close, against the Nifty50’s 2.1% gain, demonstrated relative outperformance, but the real story was in the stock’s ability to hold above the ₹1,900 level after the anchor lock-in expiry. The volume-weighted average price (VWAP) on the listing day stood at ₹1,875, and the stock consistently traded above this level in the second half of the thirty-day period, indicating that institutional accumulation was absorbing the supply from early sellers. The weekly chart showed a bullish engulfing candle in the week of September 23, followed by a small-bodied candle in the expiry week, suggesting a consolidation phase rather than a distribution top.
The brokerage initiation reports and the rising institutional holdings provided a fundamental backbone for the stock. The order book of ₹5,200 crore, which was 3.5 times the company’s FY24 revenue, offered revenue visibility for the next two years. The capacity expansion plans, which aimed to increase cell manufacturing from 2 GW to 5 GW by FY26, aligned with the government’s target of 500 GW of renewable energy capacity by 2030. The stock’s valuation, at 38 times FY26 earnings based on the October 3 close of ₹2,010, was at a premium to the sector, but the premium was justified by the scarcity of pure-play domestic cell manufacturers in the listed space. The technical setup, with the 20-day moving average at ₹1,920 and the 50-day moving average at ₹1,950, provided a strong support zone that had been tested and held during the lock-in expiry. The RSI on the daily chart at 58 indicated that the stock was neither overbought nor oversold, leaving room for a gradual uptrend.
VERDICT
Stance: BULLISH
Horizon: 5d / 1mo / 3mo
The short-term (5-day) outlook was neutral to slightly positive, as the stock was likely to consolidate in the ₹1,950 to ₹2,100 range after the anchor lock-in event, with immediate resistance at the recent high of ₹2,050. The one-month and three-month horizons, however, presented a bullish case. The institutional accumulation pattern, the strong order book, and the sectoral tailwinds suggested that the stock could re-rate further as more brokerage coverage emerged and as the company reported its quarterly numbers. The successful absorption of anchor selling on October 3 was a critical test of demand, and the stock’s ability to close above the 50-day moving average on that day signalled that long-only funds were using the dip to add to their positions. Any correction towards the ₹1,920 level was likely to be bought into, making the risk-reward favourable for a medium-term investor.
Over the next three months, the stock was expected to target the brokerage consensus range of ₹2,200 to ₹2,400, driven by news flow around capacity commissioning and order wins. The listing day high of ₹1,950, once broken, would act as a support, and the stock could enter a new orbit if the company delivered on its execution promises. The primary risk remained a broader market correction or a sudden shift in government policy on solar imports, but with the ALMM firmly in place and the PLI benefits accruing, Premier Energies was well positioned to outperform the Nifty50 by a significant margin. The thirty-day journey from the 120% listing pop to the lock-in expiry had separated the speculative froth from the fundamental core, and the verdict at the end of that period was that the stock had earned its premium valuation and was poised for the next leg of its upward journey.
Disclaimer: This article is for informational purposes only and does not constitute investment advice. The author held no positions in the stocks discussed at the time of writing.