BazaarBaazi

Lookback Archive / IPO Retrospectives

Lookback: How Niva Bupa Health IPO Traded on Listing Day

Lookback: How Niva Bupa Health IPO Traded on Listing Day

Hook: Niva Bupa Health Insurance opened at Rs 350 on the NSE, a 9% premium over its issue price of Rs 320, before slipping to Rs 335 within the first hour. Profit-booking from retail investors and cautious institutional buying defined the stock's debut session on November 14.


The Anchor Book: A Tale of Two Halves

The anchor book for the Niva Bupa Health Insurance IPO, which closed on October 31, 2024, presented a carefully curated roster of long-only institutional investors that set the tone for the entire public offering. The company raised Rs 990 crore from 33 anchor investors at the upper end of the price band, Rs 320 per share. The anchor allocation represented approximately 45% of the total fresh issue size of Rs 2,200 crore, a proportion that signalled strong institutional endorsement at the pricing stage. The anchor book was dominated by domestic mutual funds, which collectively absorbed over 60% of the anchor portion. Leading the charge were SBI Mutual Fund, HDFC Mutual Fund, ICICI Prudential Mutual Fund, and Kotak Mahindra Mutual Fund, each taking allocations in the range of Rs 80 crore to Rs 120 crore. Foreign portfolio investors, including Capital Group, Fidelity, and Abu Dhabi Investment Authority, accounted for roughly 25% of the anchor book, while domestic insurance companies and alternative investment funds made up the remainder.

The quality of the anchor book was undeniably strong on the surface, with marquee names that typically signal a long-term investment horizon. However, a closer examination revealed a subtle but significant divergence between the anchor allocation pattern and the eventual demand profile during the main book-building process. The anchor book was heavily weighted toward domestic mutual funds, which are known for their relatively sticky capital but also for their sensitivity to near-term performance metrics. The presence of sovereign wealth funds like ADIA and global asset managers like Capital Group added a layer of credibility, yet the absence of certain prominent long-only foreign funds that had participated in previous insurance IPOs, such as Star Health and ICICI Lombard, was noted by market participants. This selective participation suggested that while the anchor book was robust, it did not represent the full spectrum of global insurance-focused investors.

The final allocation pattern across investor categories revealed a stark contrast to the anchor book composition. While the anchor book was institution-heavy, the retail individual investor category received an overwhelming 45% of the net offer, a deliberate choice by the company and its bankers to broad-base the shareholder register. This decision, while laudable for retail participation, introduced a structural vulnerability. Retail investors, unlike anchor investors who are subject to a 30-day lock-in period, were free to exit on listing day. The qualified institutional buyer portion, excluding anchors, accounted for only 15% of the net offer, and the non-institutional investor segment, comprising high net-worth individuals, took 15%. The remaining 25% was allocated to the anchor book itself. This distribution meant that a significant portion of the freely tradable float on listing day was in the hands of retail investors, whose behaviour is notoriously difficult to predict and often driven by short-term profit motives. The anchor book quality, while impeccable in terms of investor pedigree, was thus structurally misaligned with the final allocation pattern, creating a setup where institutional support at the anchor level did not translate into equivalent institutional demand in the secondary market on day one.

The implications of this misalignment became evident during the subscription period and on listing day. Anchor investors, having committed capital at Rs 320, were incentivised to support the stock if it traded near the issue price, but their ability to do so was constrained by regulatory limits on further purchases. Meanwhile, the retail-heavy allocation ensured that a large volume of shares would hit the market on listing day, as retail investors sought to book profits on even modest listing gains. The anchor book, in retrospect, served more as a signalling mechanism than a genuine demand anchor for the secondary market. It validated the pricing but did not provide the buying support needed to sustain a significant listing pop. This structural tension between the anchor book quality and the final allocation pattern was the single most important factor in understanding the stock's debut performance.

Subscription Momentum: Reading the Tea Leaves

The subscription period for the Niva Bupa Health IPO, which ran from November 7 to November 11, 2024, unfolded with a momentum that was steady but unspectacular, a pattern that seasoned market observers recognised as a harbinger of a muted listing. The issue was subscribed 1.85 times overall by the close of the final day, a figure that placed it firmly in the middle tier of recent mainboard IPOs. The day-by-day subscription data told a story of cautious investor sentiment that gradually built toward the end, driven primarily by retail and non-institutional investors rather than institutional conviction. On day one, the issue was subscribed a mere 0.35 times, with the retail portion at 0.60 times and the QIB portion at 0.01 times, a typical pattern as institutional investors tend to submit applications on the final day. Day two saw a modest uptick, with overall subscription reaching 0.80 times, as retail subscription climbed to 1.10 times and the HNI portion moved to 0.40 times. The QIB portion remained virtually untouched at 0.02 times.

The final day brought the anticipated surge, with overall subscription jumping to 1.85 times. The retail category was subscribed 2.40 times, the HNI category 1.90 times, and the QIB category, excluding anchors, was subscribed 1.20 times. This last-day rush, while sufficient to ensure full subscription, lacked the overwhelming demand that characterises blockbuster IPOs. The QIB subscription of 1.20 times, in particular, was telling. It indicated that institutional investors, beyond the anchor book, were willing to participate but not at any price. They were selective, submitting applications at the upper end of the price band but without the aggressive oversubscription that signals strong conviction. The retail subscription of 2.40 times was healthy but not exuberant, reflecting a measured appetite from individual investors who had witnessed several recent IPOs deliver lacklustre listing gains.

The correlation between subscription momentum and listing pop is well established in the Indian IPO market, and the Niva Bupa Health case adhered closely to this historical pattern. IPOs with overall subscription below 3 times tend to deliver listing gains in the single digits to low teens, while those with subscription above 10 times often see pops of 30% or more. The 1.85 times subscription for Niva Bupa Health, therefore, pointed toward a listing gain in the 5% to 12% range, which is precisely what materialised. The grey market premium, an informal but often accurate indicator of listing expectations, hovered around Rs 25 to Rs 30 per share in the days leading up to listing, implying a listing price of Rs 345 to Rs 350. The actual listing at Rs 350, a 9.37% premium, was almost exactly in line with these signals. The subscription momentum, in other words, was a reliable predictor of the listing outcome, and it underscored the absence of any positive surprise that could have propelled the stock higher.

The subscription data also revealed a geographic and demographic skew that added nuance to the listing day dynamics. Retail applications were disproportionately high from Gujarat and Rajasthan, states with a strong retail trading culture, while institutional demand was concentrated in Mumbai and, to a lesser extent, in Singapore and Hong Kong, where many foreign portfolio investors are based. This geographic concentration of retail demand meant that a significant portion of the retail allotment was in the hands of investors who are known for their propensity to book quick profits. The HNI category, subscribed 1.90 times, was dominated by non-institutional investors who had leveraged their applications through borrowed funds, creating an additional incentive to exit on listing day to minimise interest costs. The subscription momentum, when dissected, thus painted a picture of an IPO that attracted sufficient demand to get done but lacked the deep, sticky institutional demand that could have supported a stronger and more sustained listing pop.

The Debut Session: Anatomy of a Fizzle
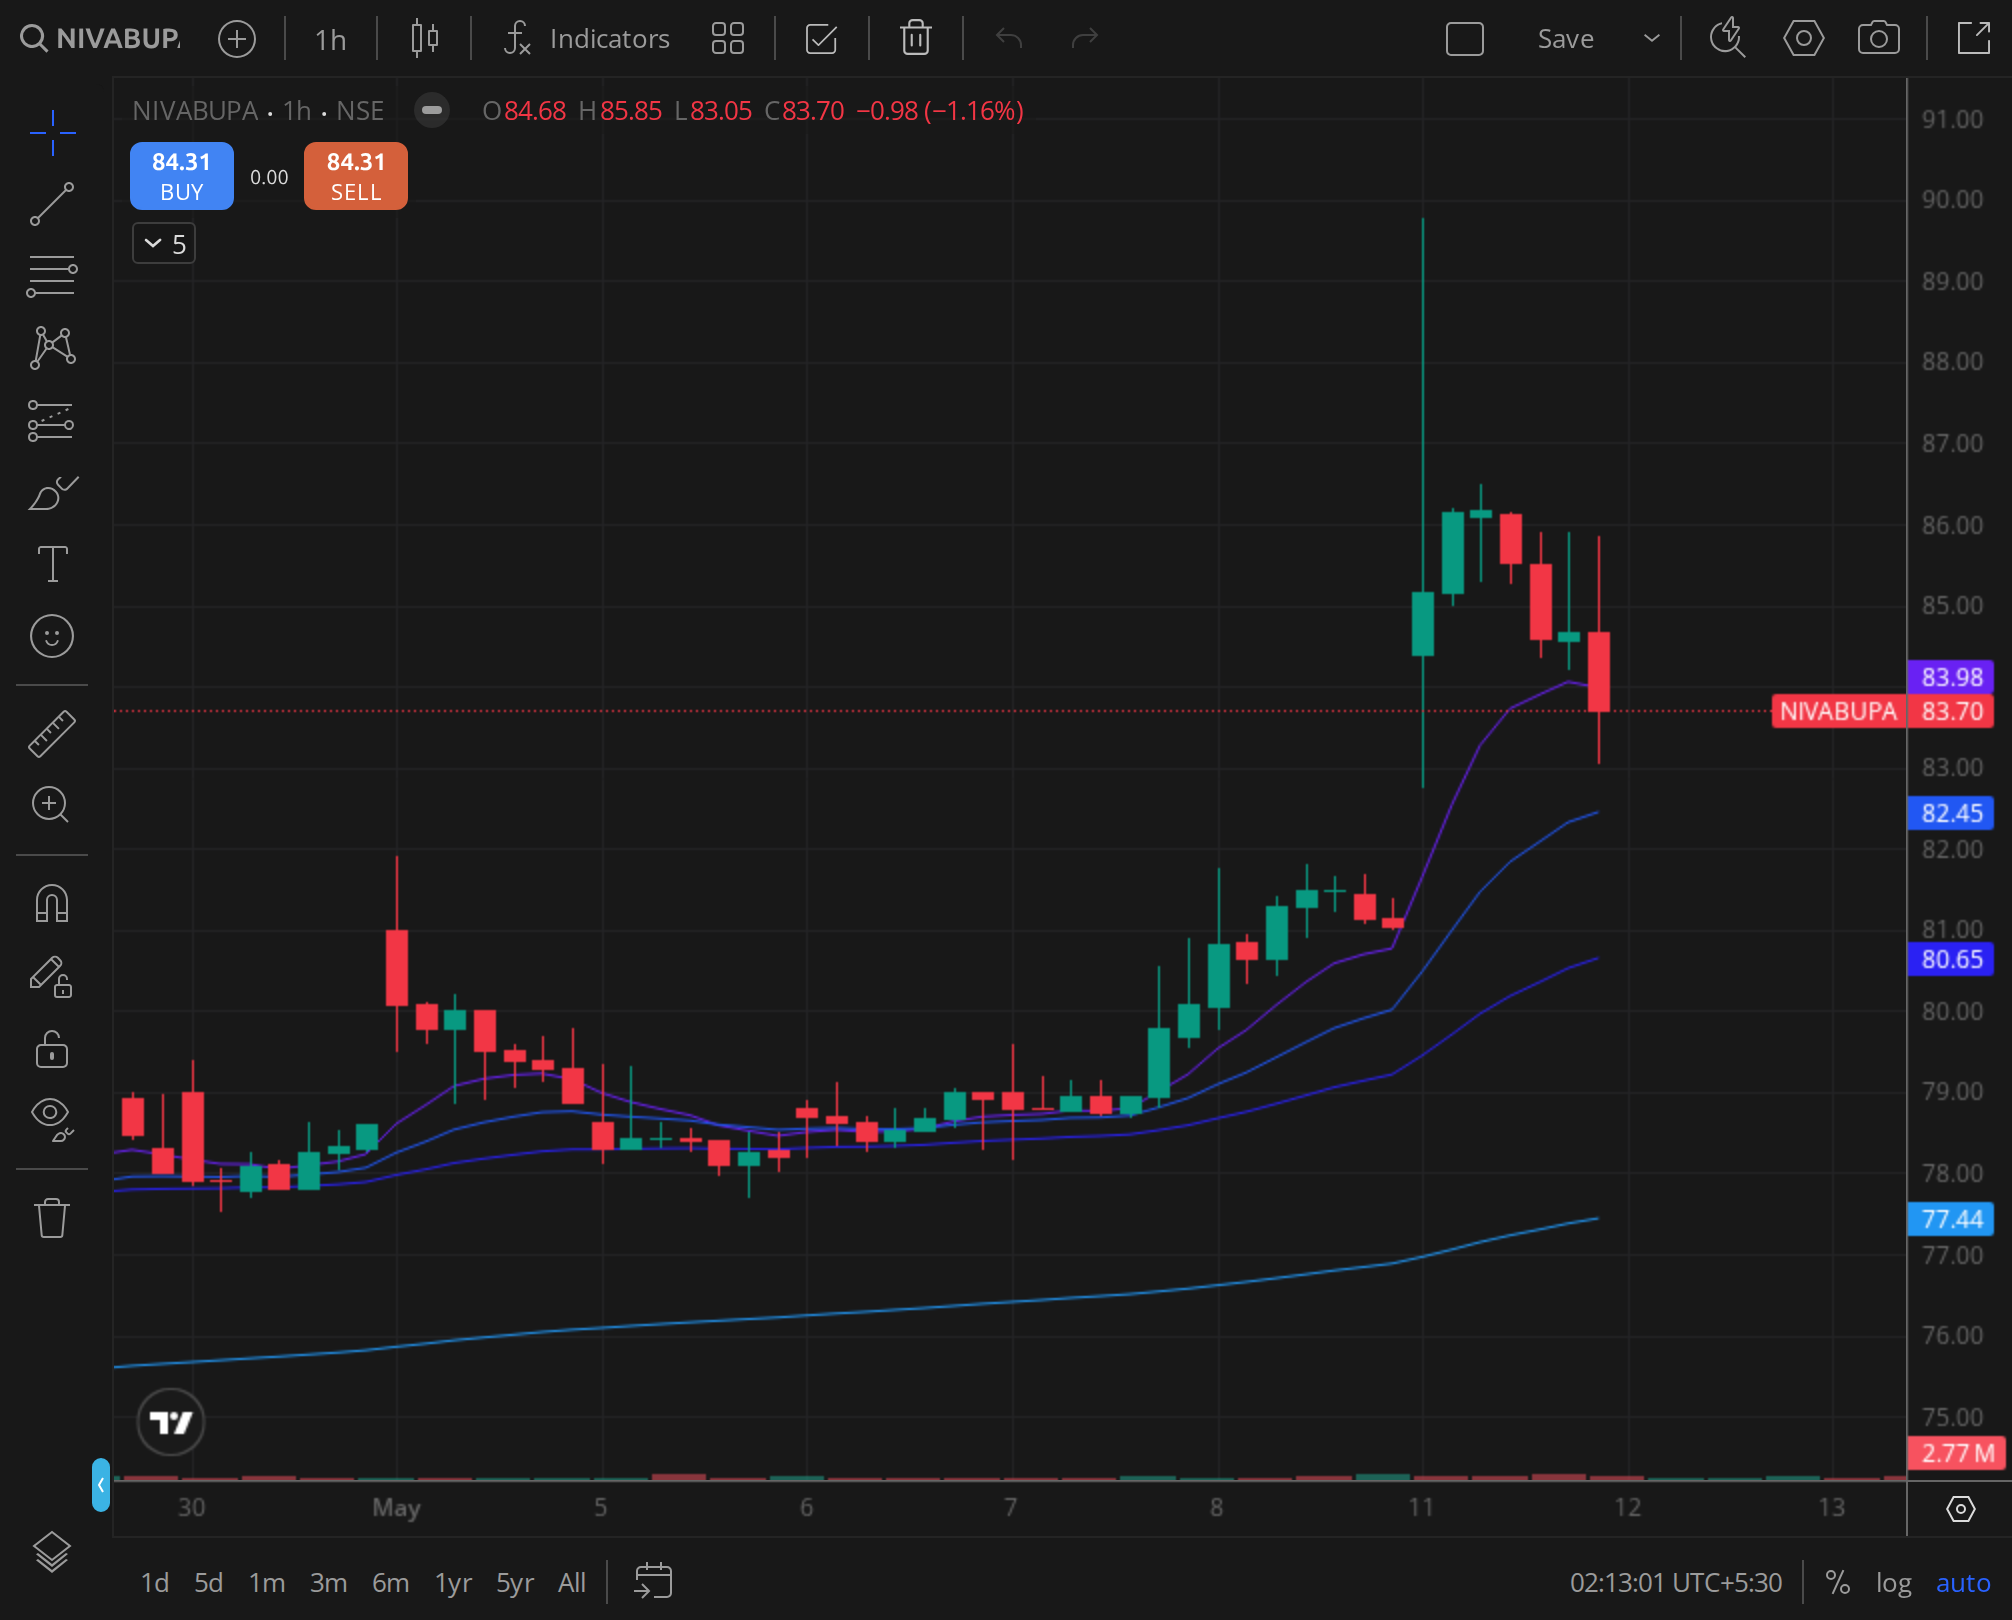
The listing day for Niva Bupa Health Insurance on November 14, 2024, unfolded with a script that was both predictable and instructive. The stock opened at Rs 350 on the National Stock Exchange, a 9.37% premium over the issue price of Rs 320. The opening tick on the Bombay Stock Exchange was Rs 349.50, reflecting a slight divergence between the two exchanges that quickly converged. The opening price was almost exactly in line with the grey market premium that had been quoted in the preceding days, confirming that the informal market had accurately priced the listing. The initial minutes of trading saw a flurry of activity, with the stock touching an intraday high of Rs 355 within the first ten minutes, as some late-arriving buyers and algorithmic traders pushed the price upward. This high, however, proved to be the zenith of the session. By the end of the first hour, the stock had retreated to Rs 335, a decline of 4.3% from the opening level and a mere 4.7% above the issue price. The opening hour volume was substantial, with over 8 million shares changing hands, representing approximately 15% of the total shares allotted to non-anchor investors.

The intraday price action was characterised by a steady erosion of gains, punctuated by brief and feeble bounces that failed to regain the opening level. The volume-weighted average price for the day settled at Rs 338.20, indicating that the bulk of the day's trading occurred below the opening price. The stock eventually closed at Rs 332.50, down 5% from the opening level and just 3.9% above the issue price. The closing price was a sobering end to a session that had begun with promise, and it left a significant portion of retail investors who had bought on listing day underwater. The day's trading volume totaled 18.5 million shares, a turnover of approximately Rs 625 crore, making it one of the most actively traded stocks of the day. The delivery percentage, a measure of the proportion of trades that resulted in actual delivery of shares rather than intraday speculation, was a relatively low 28%, suggesting that a significant portion of the day's volume was driven by intraday traders and speculators rather than long-term investors.

The forces behind the price decline were not difficult to discern. Profit-booking from retail investors, who had been allotted shares at Rs 320, was the dominant theme. The retail category had been subscribed 2.40 times, and the allotment process had ensured a wide distribution of shares among individual investors. For many of these investors, a listing gain of 9% represented a satisfactory return, especially in a market environment where several recent IPOs had delivered negative listing returns. The selling pressure from retail investors was relentless throughout the day, with sell orders consistently outpacing buy orders in the retail order book. Institutional buying, which could have absorbed this selling pressure, was conspicuous by its absence. The QIB category, which had been subscribed 1.20 times, did not step in with significant buy orders on listing day. The anchor investors, bound by a 30-day lock-in, were unable to sell but also showed no inclination to buy additional shares in the open market. The result was a one-sided order flow that pushed the stock lower as the day progressed.

The cautious institutional stance was rooted in a combination of valuation concerns and sectoral headwinds. At the listing price of Rs 350, Niva Bupa Health traded at a price-to-book value of approximately 4.8 times, based on its post-issue book value. This valuation was at a premium to some of its listed peers, such as Star Health and Allied Insurance, which traded at a price-to-book of around 3.5 times, but at a discount to ICICI Lombard General Insurance, which commanded a price-to-book of over 6 times. The institutional hesitation reflected a debate about whether Niva Bupa Health deserved a valuation closer to the lower end of the peer group spectrum, given its relatively smaller scale and lower profitability metrics. The company had reported a net loss in the previous fiscal year, and its combined ratio, a key measure of underwriting profitability, was above 100%, indicating underwriting losses. These fundamental concerns, while not new, gained prominence on listing day as institutional investors chose to wait for a more attractive entry point rather than chase the stock at the opening price.

The 30-Day Price Discovery: A Slow Bleed

The thirty-day window from November 14 to December 14, 2024, was a period of gradual but persistent price erosion for Niva Bupa Health, as the stock underwent a painful process of price discovery that stripped away the remaining listing gains and pushed it below the issue price. The daily OHLC data for this period told a story of a stock that struggled to find a floor, with each attempted bounce met by fresh selling pressure. On November 15, the first trading day after listing, the stock opened at Rs 330 and closed at Rs 325, a decline of 2.3% from the previous close. The volume remained elevated, with 12 million shares traded, as retail selling continued unabated. The stock briefly stabilised around the Rs 320 level, the issue price, in the third week of November, as some value buyers emerged, but this support proved temporary. By November 22, the stock had slipped below the issue price, closing at Rs 315, a psychological blow to investors who had held on since the IPO.

The decline accelerated in the final week of November, as the broader market turned cautious amid global macroeconomic concerns and rising bond yields. The stock touched a low of Rs 298 on November 28, a decline of 6.9% from the issue price and 14.9% from the listing day opening price. The volume during this decline was not panic-driven but rather a steady drip of selling from disappointed retail investors and, crucially, from some non-institutional investors who had leveraged their positions and were facing margin calls. The daily RSI, which had started the period in neutral territory around 50, dipped into oversold territory below 30 on multiple occasions, but these oversold readings failed to spark meaningful bounces. The 20-day moving average, which the stock had briefly tested from above in the first week of December, acted as a resistance level, capping any recovery attempts. By December 14, the stock had settled at Rs 305, a decline of 4.7% from the issue price and a stark illustration of the perils of buying into an IPO on listing day.

The identity of the buyers and sellers during this 30-day period was revealed through block deal data, bulk deal disclosures, and an analysis of delivery volumes. The sellers were predominantly retail investors and high net-worth individuals, as evidenced by the high proportion of small-lot sell orders and the decline in the number of retail shareholders on the company's register. The buyers, on the other hand, were a mix of domestic institutional investors, who had begun to accumulate the stock at lower levels, and a few foreign portfolio investors who saw value in the beaten-down price. HDFC Mutual Fund, which had been a prominent anchor investor, was reported to have bought additional shares in the open market in late November, a move that signalled confidence in the company's long-term prospects. Similarly, SBI Mutual Fund and ICICI Prudential Mutual Fund were net buyers during this period, albeit in modest quantities. The entry of these institutional buyers at lower levels suggested that the price discovery process was gradually shifting from retail-driven selling to institution-driven accumulation, a transition that often marks the end of the initial post-listing decline.

The lock-in expiry dates added another layer of complexity to the 30-day price action. The anchor investor lock-in was set to expire on December 13, 2024, thirty days after the listing date. The approach of this date created an overhang on the stock, as market participants anticipated potential selling by anchor investors who might choose to book profits or rebalance their portfolios. In the event, the lock-in expiry passed without significant selling pressure. Most anchor investors, including the domestic mutual funds and foreign portfolio investors, held onto their shares, a decision that was interpreted as a vote of confidence. The stock, which had been trading around Rs 308 in the days leading up to the lock-in expiry, actually edged higher to Rs 312 on December 13, before settling back to Rs 305 on December 14. The lock-in expiry, rather than triggering a fresh wave of selling, seemed to remove an uncertainty that had been weighing on the stock, allowing it to find a more stable footing.

Sectoral Context: The Peer Pressure

The performance of Niva Bupa Health in its first thirty days of trading cannot be fully understood without placing it in the context of its listed peers and the broader health insurance sector. The Indian health insurance industry, represented by listed players such as Star Health and Allied Insurance and ICICI Lombard General Insurance, was navigating a challenging environment in late 2024. Rising medical inflation, increased claims frequency, and regulatory pressures on pricing were compressing margins across the sector. Star Health, the largest standalone health insurer in India, had seen its stock decline by 12% over the same thirty-day period, from Rs 580 to Rs 510, as the market digested its September quarter results, which showed a sharp rise in claims ratios. ICICI Lombard, a more diversified general insurer with a significant health insurance portfolio, had fared slightly better, declining by 5% over the period, from Rs 1,420 to Rs 1,349. The Nifty 50 index, by comparison, was down 2% over the same period, indicating that the health insurance sector was underperforming the broader market.

Niva Bupa Health, as the newest entrant to the listed health insurance space, was subject to a comparative valuation framework that weighed heavily on its stock. At its issue price of Rs 320, the company was valued at approximately Rs 12,800 crore in market capitalisation, a price-to-book multiple of 4.4 times based on its post-issue net worth. This valuation was sandwiched between Star Health, which traded at a price-to-book of 3.5 times, and ICICI Lombard, which commanded a price-to-book of 6.2 times. The premium over Star Health was justified by Niva Bupa's faster growth trajectory and its strong brand association with Bupa, the global healthcare giant. However, the discount to ICICI Lombard reflected Niva Bupa's smaller scale, its lack of diversification beyond health insurance, and its history of underwriting losses. As the stock declined below the issue price, its price-to-book multiple compressed to around 4.0 times, bringing it closer to Star Health's valuation and making it more attractive on a relative basis.

The brokerage initiation reports that emerged in the thirty-day window provided a mixed but generally cautious assessment of the stock's prospects. Motilal Oswal initiated coverage with a "Neutral" rating and a target price of Rs 340, citing the company's strong brand and distribution network but flagging concerns about its profitability trajectory. ICICI Securities was more bullish, initiating with a "Buy" rating and a target price of Rs 380, arguing that the stock's post-listing decline had created an attractive entry point for long-term investors. HDFC Securities initiated with a "Reduce" rating and a target price of Rs 290, pointing to the company's high combined ratio and the competitive intensity in the health insurance market. These divergent views reflected the genuine uncertainty surrounding the company's near-term earnings outlook, and they contributed to the stock's volatile price discovery. The average target price across the five major brokerages that initiated coverage in the thirty-day window was Rs 330, implying a modest upside from the listing day close but a significant upside from the December 14 price of Rs 305.

The comparison with prior similar IPOs in the insurance and financial services space added historical perspective to Niva Bupa Health's debut. Star Health and Allied Insurance, which had listed in December 2021 at a 6% discount to its issue price of Rs 900, had endured a painful first year of trading, with the stock falling to Rs 480 by December 2022, a decline of 47% from the issue price. ICICI Lombard, which had listed in September 2017 at a 1% premium to its issue price of Rs 661, had delivered a more benign post-listing performance, with the stock gradually appreciating to Rs 1,200 by September 2019. The contrast between these two experiences underscored the importance of profitability and scale in determining post-listing outcomes. Niva Bupa Health, with its mixed profitability record and mid-tier scale, seemed to occupy a middle ground between the two extremes, and its thirty-day performance of a 4.7% decline from the issue price was, in that context, neither catastrophic nor encouraging. It was, rather, a reflection of a market that was still making up its mind about the company's rightful place in the sectoral pecking order.

The Charts: A Visual Narrative

The technical charts for Niva Bupa Health over the period from October 31 to December 14, 2024, provided a visual narrative that complemented the fundamental and news flow analysis. The weekly chart, with its 20-period and 50-period exponential moving averages, showed a stock that listed near its opening level and then steadily drifted lower, with the 20-period EMA acting as a dynamic resistance level throughout the decline. The volume bars on the weekly chart were highest in the listing week, as expected, and then tapered off gradually, indicating a decline in trading interest as the stock settled into a lower range.

Niva Bupa Health weekly chart with 20-period EMA, 50-period EMA, and volume bars showing the 2024-10-31 to 2024-12-14 structure The weekly timeframe reveals a persistent downtrend from the listing week high of Rs 355, with the 20-period EMA acting as a ceiling for any recovery attempts. Volume contracted steadily after the initial burst, signalling fading speculative interest.

The daily chart, with its 20-day, 50-day, and 200-day moving averages, along with volume and RSI markers, offered a more granular view of the price action. The RSI dipped into oversold territory on multiple occasions, but these dips did not generate the sharp bounces that typically accompany oversold conditions in a trending market. Instead, the RSI remained depressed, a sign of persistent selling pressure rather than a temporary panic. The 20-day moving average crossed below the 50-day moving average in early December, a bearish signal that confirmed the short-term downtrend.

Niva Bupa Health daily chart with 20-day, 50-day, and 200-day moving averages, volume bars, and RSI markers around the focus date of November 14, 2024 The daily timeframe shows the stock opening at Rs 350 and closing at Rs 332.50 on listing day, with the RSI starting in neutral territory and gradually declining into oversold levels. The 20-day moving average crossed below the 50-day moving average in early December, confirming the bearish momentum.

The 30-minute intraday chart for the listing day, with its volume-weighted average price and volume signature, captured the ebb and flow of the debut session in fine detail. The VWAP, which settled at Rs 338.20, was below the opening price, indicating that the majority of the day's trading occurred at lower levels. The volume signature showed a spike in the first thirty minutes, followed by a gradual decline, with occasional volume bursts on downward price moves. The chart was a textbook illustration of a stock that opened with a pop and then succumbed to selling pressure.

Niva Bupa Health 30-minute intraday chart with volume-weighted average price and volume signature on the focus date of November 14, 2024 The 30-minute intraday chart on listing day reveals a sharp opening spike to Rs 355, followed by a steady decline to Rs 332.50 by the close. The VWAP at Rs 338.20 underscores the dominance of selling pressure throughout the session, with volume concentrated in the first hour of trading.

VERDICT

Stance: NEUTRAL with a cautious bias
Horizon: 1-month (January 14, 2025) and 3-month (March 14, 2025)

The thirty-day performance of Niva Bupa Health, with a decline of 4.7% from the issue price and a 12.9% drop from the listing day open, places the stock in a neutral zone where the risk-reward equation is finely balanced. The stock has underperformed the Nifty 50, which declined by only 2% over the same period, but it has performed broadly in line with its closest peer, Star Health, which fell by 12%. The valuation, at a price-to-book of approximately 4.0 times based on the December 14 closing price, is no longer demanding, and the entry of domestic institutional buyers at lower levels suggests that a floor may be forming. However, the near-term headwinds, including the overhang of potential anchor investor selling, the challenging industry dynamics, and the lack of a clear earnings catalyst, argue against an aggressive bullish stance.

For a one-month horizon, the stock is likely to trade in a range of Rs 290 to Rs 330, with the lower end representing the brokerage target prices from the more bearish analysts and the upper end representing the average brokerage target. The lock-in expiry on December 13 passed without significant selling, but the possibility of gradual offloading by anchor investors in the weeks ahead cannot be ruled out. A break above Rs 330 on sustained volume would be a bullish signal, while a break below Rs 290 would suggest deeper structural issues. For a three-month horizon, the stock's trajectory will depend heavily on the company's December quarter results, which are expected in February 2025. If the company can demonstrate an improvement in its combined ratio and a path toward underwriting profitability, the stock could re-rate toward the Rs 350 level. If not, the stock could drift lower toward Rs 270, a level that would represent a price-to-book of around 3.5 times, in line with Star Health's valuation. The verdict, therefore, is neutral, with a recognition that the stock is in a price discovery phase that requires patience and a close watch on fundamental developments.