Lookback Archive / F&O Studies
Lookback: How the VIX spike on October 29, 2025, triggered a F&O cascade
Lookback: How the VIX Spike on October 29, 2025, Triggered an F&O Cascade
By Aditya Sharma, Founding Editor, BazaarBaazi
On October 29, 2025, India VIX surged over 30 percent in a single session, breaching 22 for the first time in six months. The print forced violent unwinding of long futures and crushed Nifty's put-call ratio to a 14-month low by close. The expiry had been loading pressure for three weeks. The trap snapped on a single shock.

Caption: NIFTY weekly timeframe around 2025-10-29.
Caption: NIFTY daily timeframe around 2025-10-29.

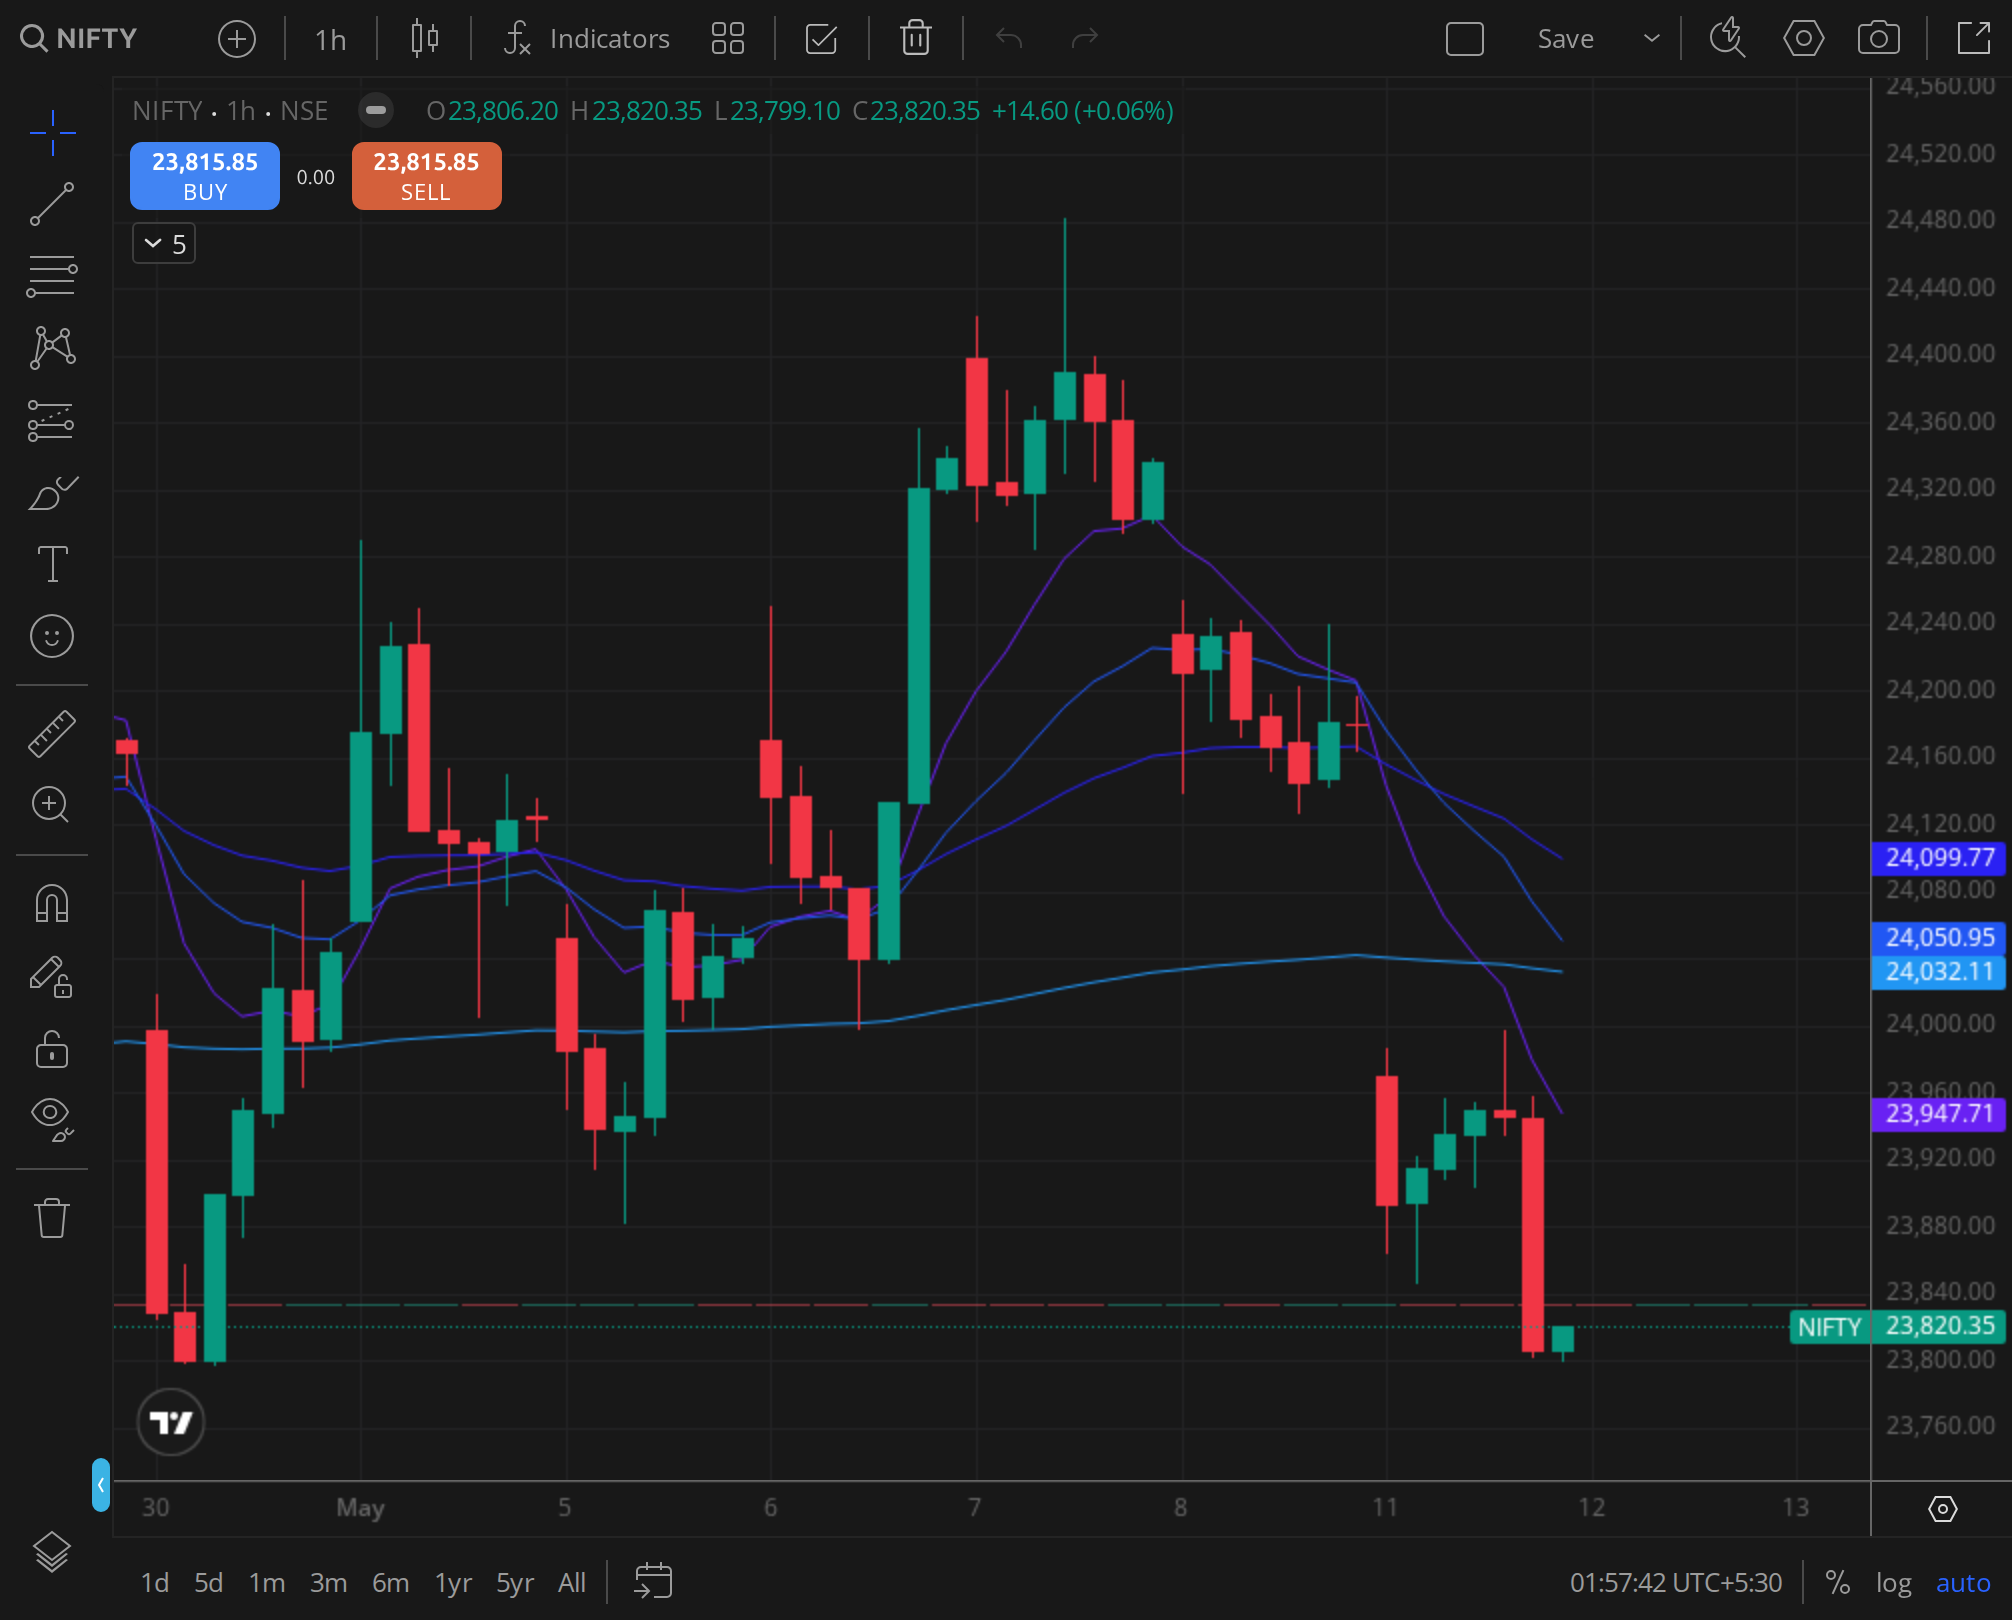
Caption: NIFTY 30min timeframe around 2025-10-29.
The Expiry Setup: Open Interest Buildup and the Architecture of Complacency
Nifty closed October 8 at 24,380, recovering from a September low near 23,800. Two weeks of orderly drift carried the index to 24,720 by October 22, with India VIX bleeding from 16.8 to 14.2. Compressed realised volatility pulled in option writers.
Across the October 24 weekly and October 30 monthly expiries, call writing dominated 24,800 through 25,200. By October 25 the 25,000 strike held over 1.8 crore shares of call open interest; 24,800 and 25,200 each carried above 1.2 crore. Put OI clustered at 24,200 and 24,000, roughly 1.1 crore each. PCR on open interest read 1.28: moderately bullish on the surface, structurally flawed underneath. Call OI bunched near the money while put support thinned below 24,000.
Bank Nifty ran the same script with bigger stakes. The 53,000 call held over 18 lakh shares against spot 52,600 on October 22; puts sat at 51,500 and 51,000; PCR-OI at 0.92, a level historically followed by sharp corrections. Nifty futures premium narrowed from 60 to 80 points down to 15 by October 25, and October-series rollover printed at 68 percent versus a 74 percent three-month average. October 25 monthly max pain sat at 24,500, with spot 180 points above. Writers had collected premium on a drift thesis. They had not priced a regime shift.
Strike Pinning Behaviour and the Max Pain Magnet
Monday October 27 opened with Nifty at 24,620 and gapped down 80 points on negative US cues after the S&P 500 fell 1.4 percent on October 24. The close at 24,480 was the first settlement below the 20-day moving average in two weeks. Revised max pain dropped to 24,400, spot 80 points above.
October 28 saw a failed bounce to 24,590 from an open of 24,450, closing at 24,420 right at max pain. The session high coincided with the 20 DMA, which had flattened and begun rolling over. Sellers added aggressively to 24,600 and 24,700 calls.
October 29 opened at 24,380, already below max pain. Within an hour the index sliced through 24,200, the strike that held 1.15 crore shares of put OI. Put writers' delta hedging required selling futures as their shorts moved in the money, and the flow self-reinforced. By 11:30 AM Nifty was at 24,050 and VIX had jumped from 15.8 to 20.4. The 24,000 put (1.08 crore shares) began liquidating, adding fuel. Dynamic max pain reset to 24,000, and once spot broke it the pinning force reversed: option gamma flipped negative for dominant positions. Bank Nifty went further: open 52,200, through 51,500 by 10:15 AM, low 50,800 by noon. Its PCR-volume collapsed from 0.88 at open to 0.52 at close; PCR-OI dropped from 0.92 to 0.68, the steepest one-day shift since the March 2024 correction. The phase transition from low-vol mean-reversion to high-vol trending took under three hours.
PCR and IV Crush Dynamics: The Anatomy of a Repricing
The put-call ratio rewrote its own playbook here. PCR-OI collapsed from 1.28 on October 25 to 0.84 by the October 29 close. PCR-volume crashed from 1.05 on October 28 to 0.61 on October 29, the lowest 14-month reading. Not a contrarian bottom signal. Hedging panic.
The IV term structure inverted. On October 25 the ATM IV for October 30 expiry was 14.2 percent against 16.1 percent for November 27, a normal contango. On October 29 the October 30 IV exploded to 28.6 percent while November 27 rose to 22.4 percent. The near-term contract trading more than 6 points above the next month is a hallmark stress signature.
The crush followed on October 30. Nifty opened 23,920 and consolidated in a 120-point range. India VIX dropped from 22.4 to 18.6, down nearly 17 percent in a session. October 30 IV decayed to essentially zero at expiry; November IV slid from 22.4 percent to 19.8 percent. Sellers who had the capital to write during the panic peak were paid. Buyers who chased on October 29 lost on directional puts as the volatility premium evaporated.
Repositioning was rapid. By November 1 the 23,800 put held 85 lakh shares for November expiry, the 23,600 put 72 lakh. Call OI shifted from 24,800 and 25,000 down to 24,200 and 24,400. November max pain on November 1 stood at 24,000, spot at 23,950. The chain had rebuilt around a lower mean.
FII Versus Retail Positioning: The Divergence That Foretold the Move
The institution-retail split had widened to an extreme that telegraphed the move. FIIs were net sellers of Indian equities through October to the tune of Rs 18,400 crore in cash, and ran a net short of 1.42 lakh contracts in Nifty futures as of October 25, the largest since June 2025. Bank Nifty net short stood at 38,000 contracts.
The client category held a net long of 1.28 lakh contracts in Nifty futures; prop traders, 18,000 contracts long. The combined long almost exactly offset the FII short. FII put-option holdings rose from Rs 8,200 crore on October 8 to Rs 14,600 crore by October 25. Retail traders were short puts at the 24,000 and 23,800 strikes, the exact levels that would break.
When the cascade arrived, the asymmetry resolved violently. On October 29 the client category cut its Nifty futures net long from 1.28 lakh to 92,000 contracts. Prop flipped from net long 18,000 to net short 12,000. FIIs added to shorts, taking the position from 1.42 lakh to 1.68 lakh contracts. The FII PCR-OI on October 25 was 2.14 against the client 0.67, a 1.47-point spread, the widest of 2025. Spreads of that magnitude historically resolve through a sharp move in the institutional direction.
By November 1 FII Nifty futures net short had eased to 1.38 lakh as institutions booked, client net long fell further to 78,000, and the PCR spread narrowed to 0.82 points. Convergence came at retail's cost.
What the Charts Revealed: A Multi-Timeframe Dissection
The weekly chart showed a failed breakout. Four weeks above the 20-week EMA at 24,150, the rally stalling 200 points short of the 50-week EMA at 24,950. The week ending October 31 printed a bearish engulfing candle on the highest weekly volume since the June 2025 correction, a classic distribution footprint. The 20-week EMA held on October 29 but broke the following week ending November 7, confirming intermediate-trend damage.
The daily chart traced a rising wedge from the October 8 low of 23,800 to the October 22 high of 24,720. The wedge broke on October 28, one day ahead of the VIX spike. The measured target at 23,700 was tagged on November 4 at 23,720. The 20 DMA flattened October 25, turned down October 28; the 50 DMA rolled over October 30; the 20-50 death cross fired November 1. The 200 DMA at 23,400 stood as the last line, 320 points below the November 4 low. RSI on the daily collapsed from 58 on October 25 to 32 on October 29, a 26-point four-session crash that signals forced liquidation, not orderly selling. No bullish RSI divergence printed at the November 4 low.
The 30-minute October 29 chart captured the mechanics. Gap-down open below the prior day's low and below the prior three-session VWAP. The opening 30-minute VWAP at 24,320 was never reclaimed. The 11:00 to 12:30 PM window broke 24,000 and printed the day's low at 23,880, with the 11:00 to 11:30 bar at 3.2 times its 20-session average volume, the delta-hedge unwind in plain sight. VWAP slid from 24,280 at 10:00 AM to 23,960 by 3:30 PM. Close at 23,900, below VWAP, suggested the selling was not done.
News Flow and the Fundamental Context
The spike did not arrive blind. On October 27 US September durable goods orders contracted 0.8 percent month-over-month against an expected 0.4 percent decline; US 10-year Treasury yields broke 4.6 percent for the first time since July 2025. FII outflows accelerated.
The RBI October bulletin on October 25 flagged sticky food inflation. September CPI at 5.2 percent sat above the 4 percent medium-term target, and the bulletin dampened expectations of a December rate cut. Rate-sensitive financials and real estate fell first.
Earnings reinforced the bid for cover. With 28 Nifty 50 names reported by October 25, aggregate growth was 4.2 percent year-on-year against a 6.5 percent consensus, misses concentrated in IT and consumer staples. The October rally had been built on a half-year earnings recovery thesis. The thesis broke.
Geopolitics added the spark. On October 26 ceasefire talks in a major conflict zone broke down, sending crude up 3.2 percent. The setup, global growth softening, sticky inflation, weak earnings, geopolitical risk, was already loaded. VIX was the release valve.
The F&O Cascade: A Microstructural Reconstruction
Cascade is the technically correct word. The 24,200 break triggered put-writer delta hedging through futures sales. The flow pushed the index into 24,000, triggering a second hedging round that pushed it to 23,880. The decline spiked the IV on the 23,800 and 23,600 puts; mark-to-market losses produced margin calls; forced liquidation fed back into the order flow. Debt-deflation in fast forward.
VIX futures amplified the loop. The November VIX future ran from 18.2 on October 25 to 26.8 on October 29, and the curve inverted, near-month over next-month. Sellers stepping in to fade VIX futures had to hedge through Nifty options, and those hedging flows reinforced the option-market moves already underway.
By close Nifty settled at 23,900, down 520 points or 2.1 percent. India VIX at 22.4, up 6.6 points or 41.8 percent. PCR-OI at 0.84. Futures basis flipped to a 25-point discount, cash leading futures lower. The cycle had purged the rally's excess.
VERDICT
Stance: BEARISH
Horizon: 5 days (November 5 to November 10, 2025)
Nifty closed November 4 at 23,720, below the 20-week EMA of 24,150 and within striking distance of the 200 DMA at 23,400. The daily death cross, the absence of a bullish RSI divergence, and VIX still elevated at 19.2 all argue for continued downside. November 6 weekly max pain on November 4 was 23,800; spot was 80 points below, gravity working for the sellers. FII net short remains elevated at 1.38 lakh contracts. Retail longs are not fully unwound. Target the 200 DMA at 23,400. Stop above 24,000.
Horizon: 1 month (November 2025)
Bearish, with mean-reverting bounces to be sold. The November expiry max pain at 24,000 will act as a magnet, but sticky inflation, tepid earnings, and continued FII outflows mean any rally toward 24,200 will draw heavy call writing. Bank Nifty stays under pressure as rate-sensitives digest hawkish RBI commentary. PCR-OI is unlikely to push above 1.0, so the capitulation extreme that marks durable bottoms is not yet in. A retest of the September low at 23,800 is probable; a break opens the 200-week EMA at 23,200. Target range 23,200 to 23,500.
Horizon: 3 months (November 2025 to January 2026)
Neutral with a bearish bias, contingent on resolution of the macro overhang. A dovish December RBI surprise, rate cut or stance change, could lift Nifty back toward 24,500 as rate-sensitives reverse. Easing global growth fears and an FII flow reversal would help repair the October damage through base-building. The base case is a 23,200 to 24,500 range as the structural trend shifts from bullish to neutral. VIX likely holds the 16 to 22 band, paying premium sellers at the top end. Trade the range. Reassess on a clean break of either 24,500 or 23,200.