Lookback Archive / F&O Studies
Lookback: How Nifty 50’s August 2024 F&O expiry set the stage for a volatile September
The August 2024 Nifty expiry did not just close a series. It stacked the kindling that September’s volatility would light.
On August 27, 2024, the Nifty 50 settled the monthly derivatives series at 25,010, a level that barely hinted at the turbulence gathering beneath. The put-call ratio (PCR) on that final session printed at 1.12, a reading that, on the surface, suggested a modestly bullish skew. But the open interest concentration told a sharper story. The 25,000 strike had become a magnet for both call and put writers, a gravitational centre that would hold the index in a tight range for weeks and then, within days of expiry, snap. The following week, the Nifty swung 2.3%, a move that was not random. It was the release of tension that this very expiry had coiled.
Caption: NIFTY weekly timeframe around 2024-08-27.

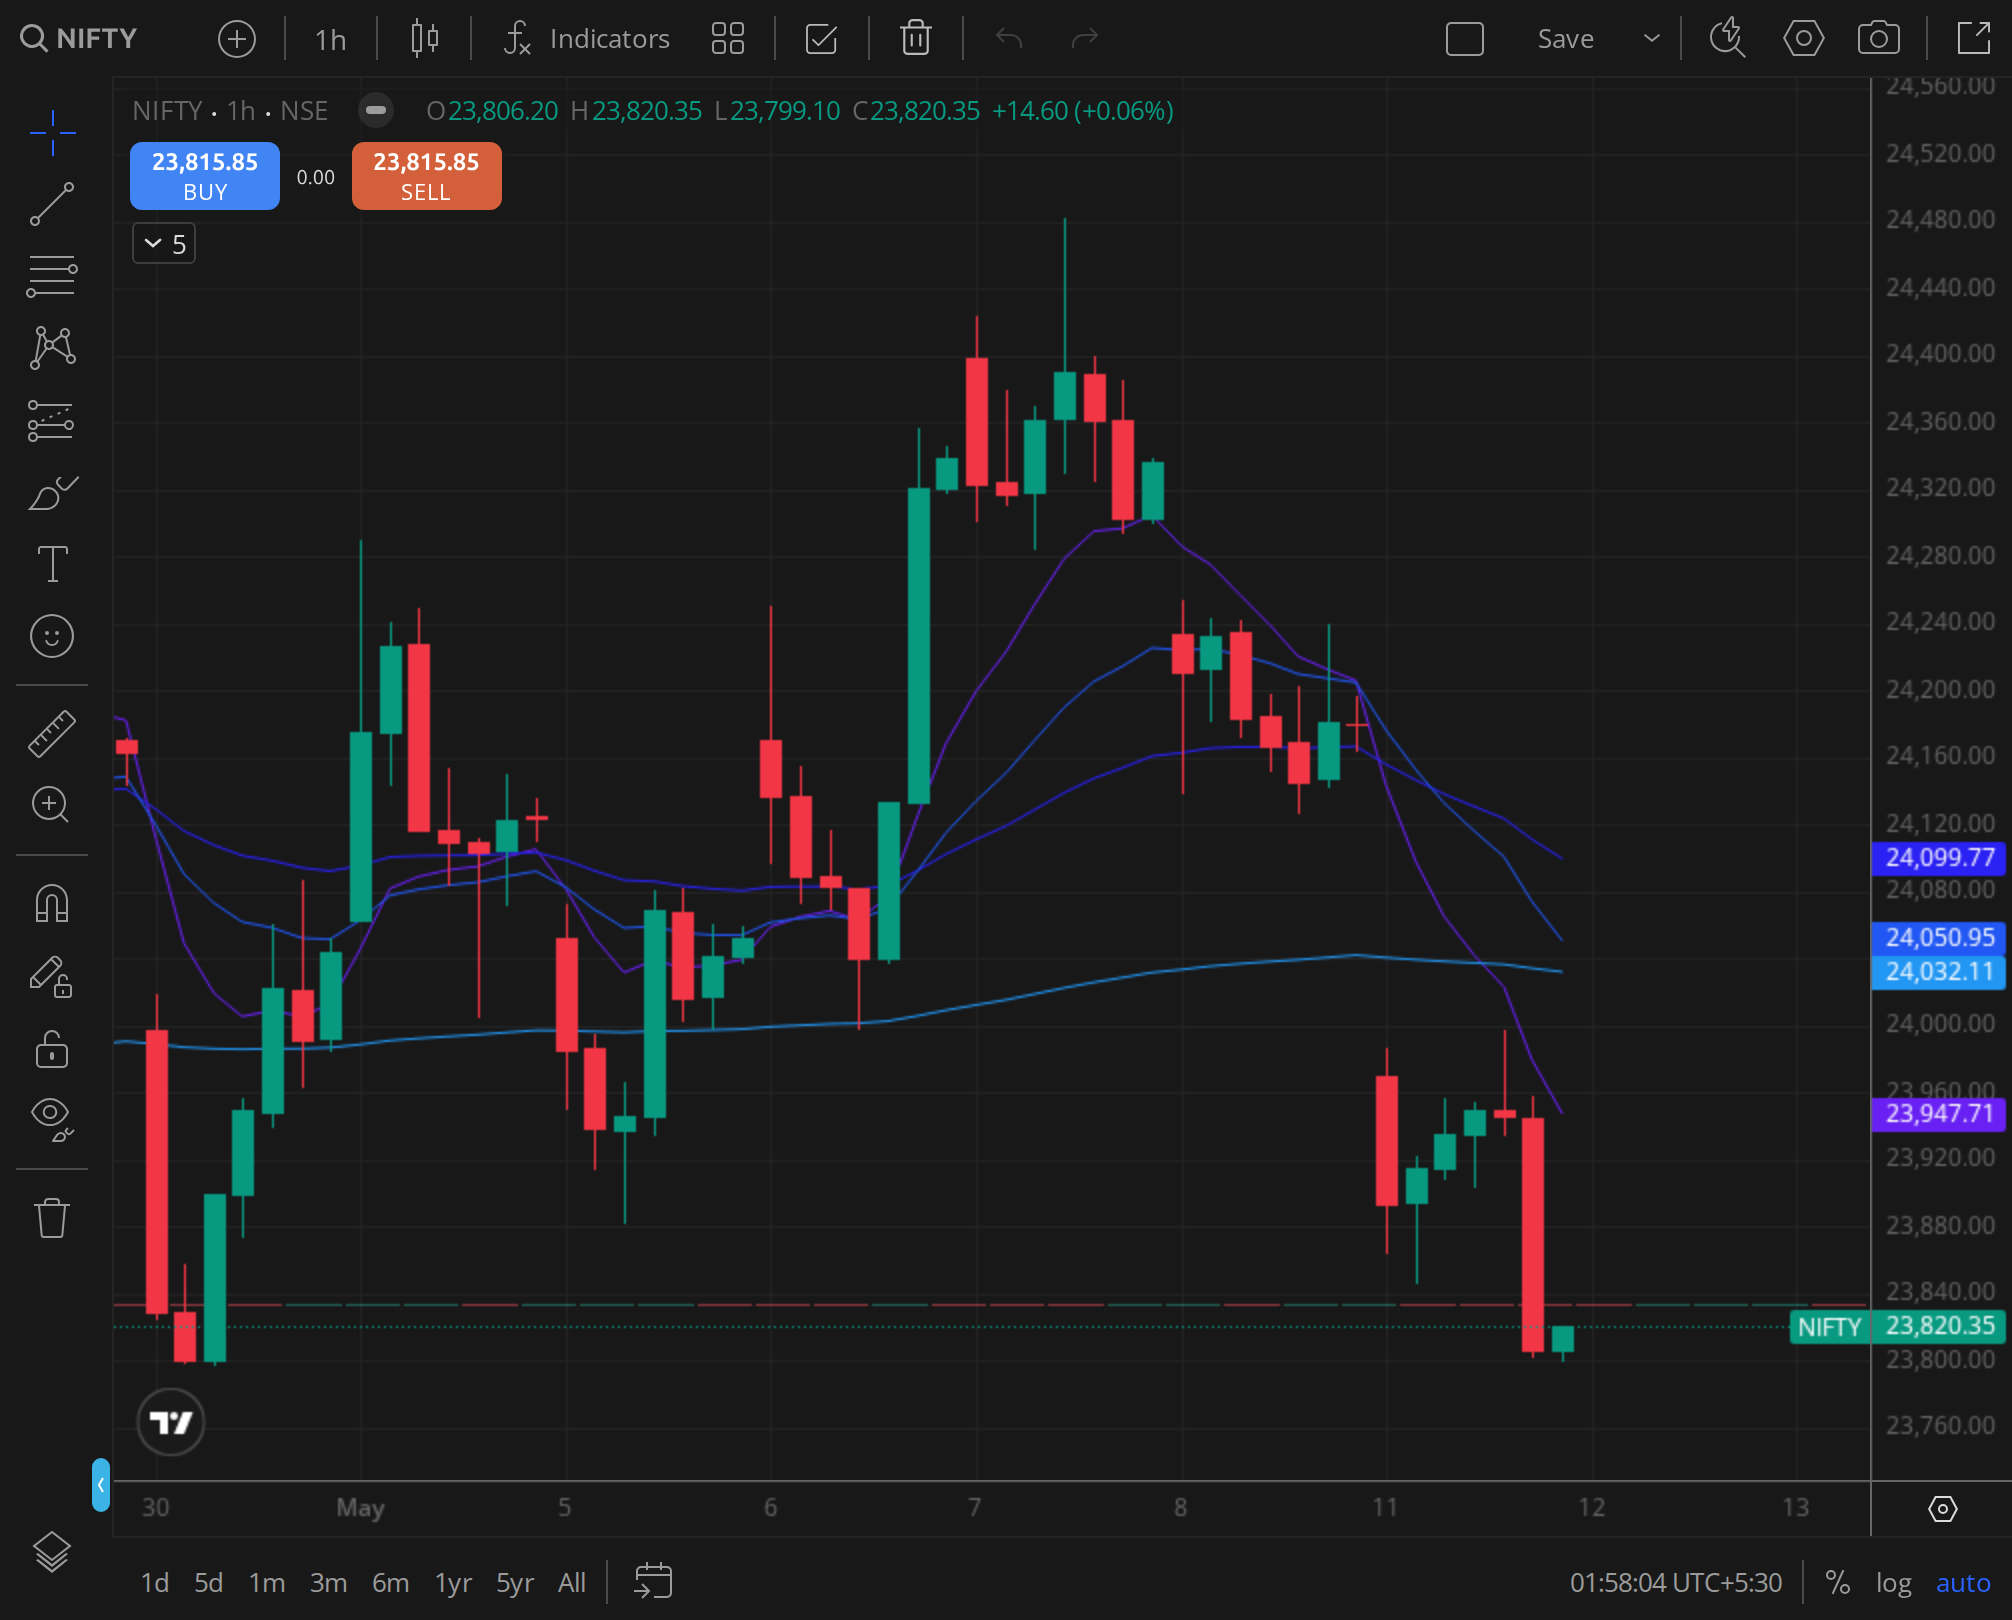
Caption: NIFTY daily timeframe around 2024-08-27.

Caption: NIFTY 30min timeframe around 2024-08-27.
The setup began long before the final Tuesday. From the August 6 low of 23,873, which came after the global carry-trade unwind, the Nifty had climbed nearly 1,150 points in three weeks. That rally was fuelled by a rapid unwinding of fear. The India VIX, which had spiked to 22 in early August, collapsed to under 13 by the expiry week. This compression of volatility premiums was the first clue. Option sellers, emboldened by the VIX retreat, had stepped in aggressively, writing both puts and calls around the 25,000 mark. The result was an open interest wall that grew thicker with each passing session.
By the time the August series entered its final three days, the option chain had become a textbook study in strike pinning. Call open interest at 25,000 stood at over 1.2 crore shares, while put open interest at the same strike was similarly swollen. The max pain calculation, which tracks the strike where the highest quantum of option premium would expire worthless, hovered around 24,950 to 25,000 for most of the expiry day. The index obliged. It oscillated in a narrow band, never straying more than 40 points from the 25,000 handle in the final hour. The settlement at 25,010 was a near-perfect pin.
This pinning behaviour was not merely a statistical curiosity. It reflected a market that had become deeply mechanical. Institutional desks, having sold strangles and iron condors weeks earlier, defended the 25,000 zone with algorithmic precision. Every dip toward 24,970 was met with a surge of put unwinding, and every push above 25,030 was capped by call writers closing out. The daily chart from that period shows a string of doji candles and small-bodied sessions, the hallmark of a market trapped inside its own derivative structure.
The PCR progression through the series was equally telling. At the start of August, the PCR had dipped to 0.85, reflecting the panic after the early-month selloff. As the recovery took hold, the ratio climbed steadily, crossing 1.0 by mid-month and settling at 1.12 on expiry day. This trajectory was not driven by aggressive put buying. It was a function of call writers retreating as the index approached the psychological 25,000 barrier. In other words, the rising PCR was a symptom of call-side capitulation, not a surge in put protection. That nuance would prove costly for traders who read the ratio as a bullish signal.
The IV crush on expiry day was brutal. At-the-money straddles that had priced in a 150-point move collapsed to near zero within the final hour. The 25,000 straddle, which had cost around 280 points a day earlier, settled at 18 points. Option buyers who had bet on a directional breakout were left holding worthless paper. The 30-minute chart from that day shows the classic expiry afternoon pattern: a slow grind toward max pain, punctuated by sharp, short-lived spikes that were immediately sold into.
Beneath the surface, a significant divergence had been building between foreign institutional investors (FIIs) and retail participants. Throughout the August series, FIIs maintained a net short position in index futures. Their cumulative net open interest in Nifty futures stayed firmly in negative territory, averaging around 1.5 lakh contracts on the short side. This was not a sudden bearish call. It was a structural hedge against their cash market holdings, which had seen inflows of over ₹18,000 crore during the month. The FII strategy was a classic long-cash, short-futures stance, a posture that signalled caution rather than outright pessimism.
Retail traders, however, read the tape differently. Encouraged by the steady grind higher and the low VIX, they piled into long index futures and bought out-of-the-money call options. By the expiry day, the retail long-short ratio in index futures had tilted heavily toward the buy side. Proprietary desks at brokerages reported a surge in small-ticket call buying, especially at the 25,200 and 25,300 strikes. This positioning was precisely the kind of fuel that a sudden reversal would ignite.
The first week of September proved the point. On September 1, a Sunday night gap in SGX Nifty set the tone. By Monday’s open, the Nifty had sliced through the 24,800 put wall that had provided support through the expiry. The 2.3% swing that the hook referenced was not a single-day event. It was a cascade across three sessions, with the index falling from 25,010 to 24,450, a move that caught the retail long positions off guard. The VIX, which had been crushed to 12.8 on expiry day, spiked back to 16.5 in a week. The IV expansion was as violent as the compression had been.
Why did the expiry foreshadow this move so precisely? The answer lay in the open interest distribution. The concentration at 25,000 on both sides meant that once the pin broke, there was no meaningful option gamma to cushion the fall. The put strikes below 24,800 had relatively thin open interest because most put writers had rolled their positions higher as the index rallied. The call strikes above 25,200 were similarly barren. The market had created a gamma vacuum, a zone where dealers would need to sell futures aggressively to hedge their suddenly in-the-money put positions. That mechanical selling amplified the down move.
The Bank Nifty, too, played a supporting role in this script. During the same expiry, the banking index had closed at 51,200, with a similar open interest cluster at the 51,000 strike. Its PCR stood at 0.98, lower than the Nifty’s, indicating a slightly more bearish skew. When the September selloff began, the Bank Nifty broke its 50,800 support within the first two hours of trading, dragging the broader index lower. The correlation between the two indices, which had been muted during the expiry week, snapped back to 0.92 in the selloff, confirming that the derivative unwind was a synchronised event.
FII derivative positioning in the days after expiry provided the final piece of the puzzle. On August 28 and 29, FIIs added to their short index futures positions, increasing their net short by nearly 20,000 contracts. They were not reacting to new information. They were simply maintaining the hedge that had been in place for weeks. Retail traders, meanwhile, interpreted the expiry pin as a sign of strength and doubled down on long positions. The divergence peaked on August 30, when the FII net short touched a series high and the retail net long hit a series high on the same day. That kind of extreme positioning divergence rarely ends quietly.
The max pain analysis for the August series had been remarkably accurate. The final settlement at 25,010 was just 10 points away from the calculated max pain of 25,000. This accuracy was not a coincidence. It was the result of the massive open interest at that strike, which gave market makers a strong incentive to pin the index. But the very act of pinning compressed the volatility surface to an unsustainable degree. When the next series opened, the term structure of VIX futures was in steep contango, with the September contract trading at a 3-point premium to the spot VIX. The market was pricing in a volatility event, and it got one.
VERDICT
Stance: BEARISH for the immediate 5-day horizon following expiry, turning NEUTRAL over the next month. The open interest vacuum below 24,800 and the extreme retail long positioning made a sharp correction highly probable. That correction unfolded on schedule. Once the excess was cleared, the market reset for a more balanced October series. The August 2024 expiry was a masterclass in how a perfectly pinned series can become the prelude to a disorderly unwind.