Lookback Archive / F&O Studies
Lookback: How Max Pain Pinned Nifty on April 25, 2025
By Aditya Sharma, Founding Editor, BazaarBaazi
On April 25, 2025, Nifty settled just 12 points from the 24,800 strike, the day’s max pain level. The options chain showed 1.2 crore shares pinned at that strike, confirming market makers had defended the highest open interest. The session was a textbook display of how derivative positioning can anchor the cash market, overriding even the most determined intraday attempts at a breakout. For traders who tracked the max pain progression through the April series, the expiry was a vindication of the theory that heavy option writing concentrates the index around the strike where the least aggregate pain is inflicted on option sellers. What made this particular expiry remarkable was not just the precision of the pin, but the convergence of multiple signals, the open interest buildup pattern, the put-call ratio dynamics, the FII versus retail divergence, and the subsequent volatility crush that left late directional buyers nursing losses. This archive piece dissects each of those layers, drawing on the data from April 4 through May 2, 2025, to reconstruct how the April 25 expiry became a masterclass in max pain pinning.

Caption: NIFTY weekly timeframe around 2025-04-25.
Caption: NIFTY daily timeframe around 2025-04-25.

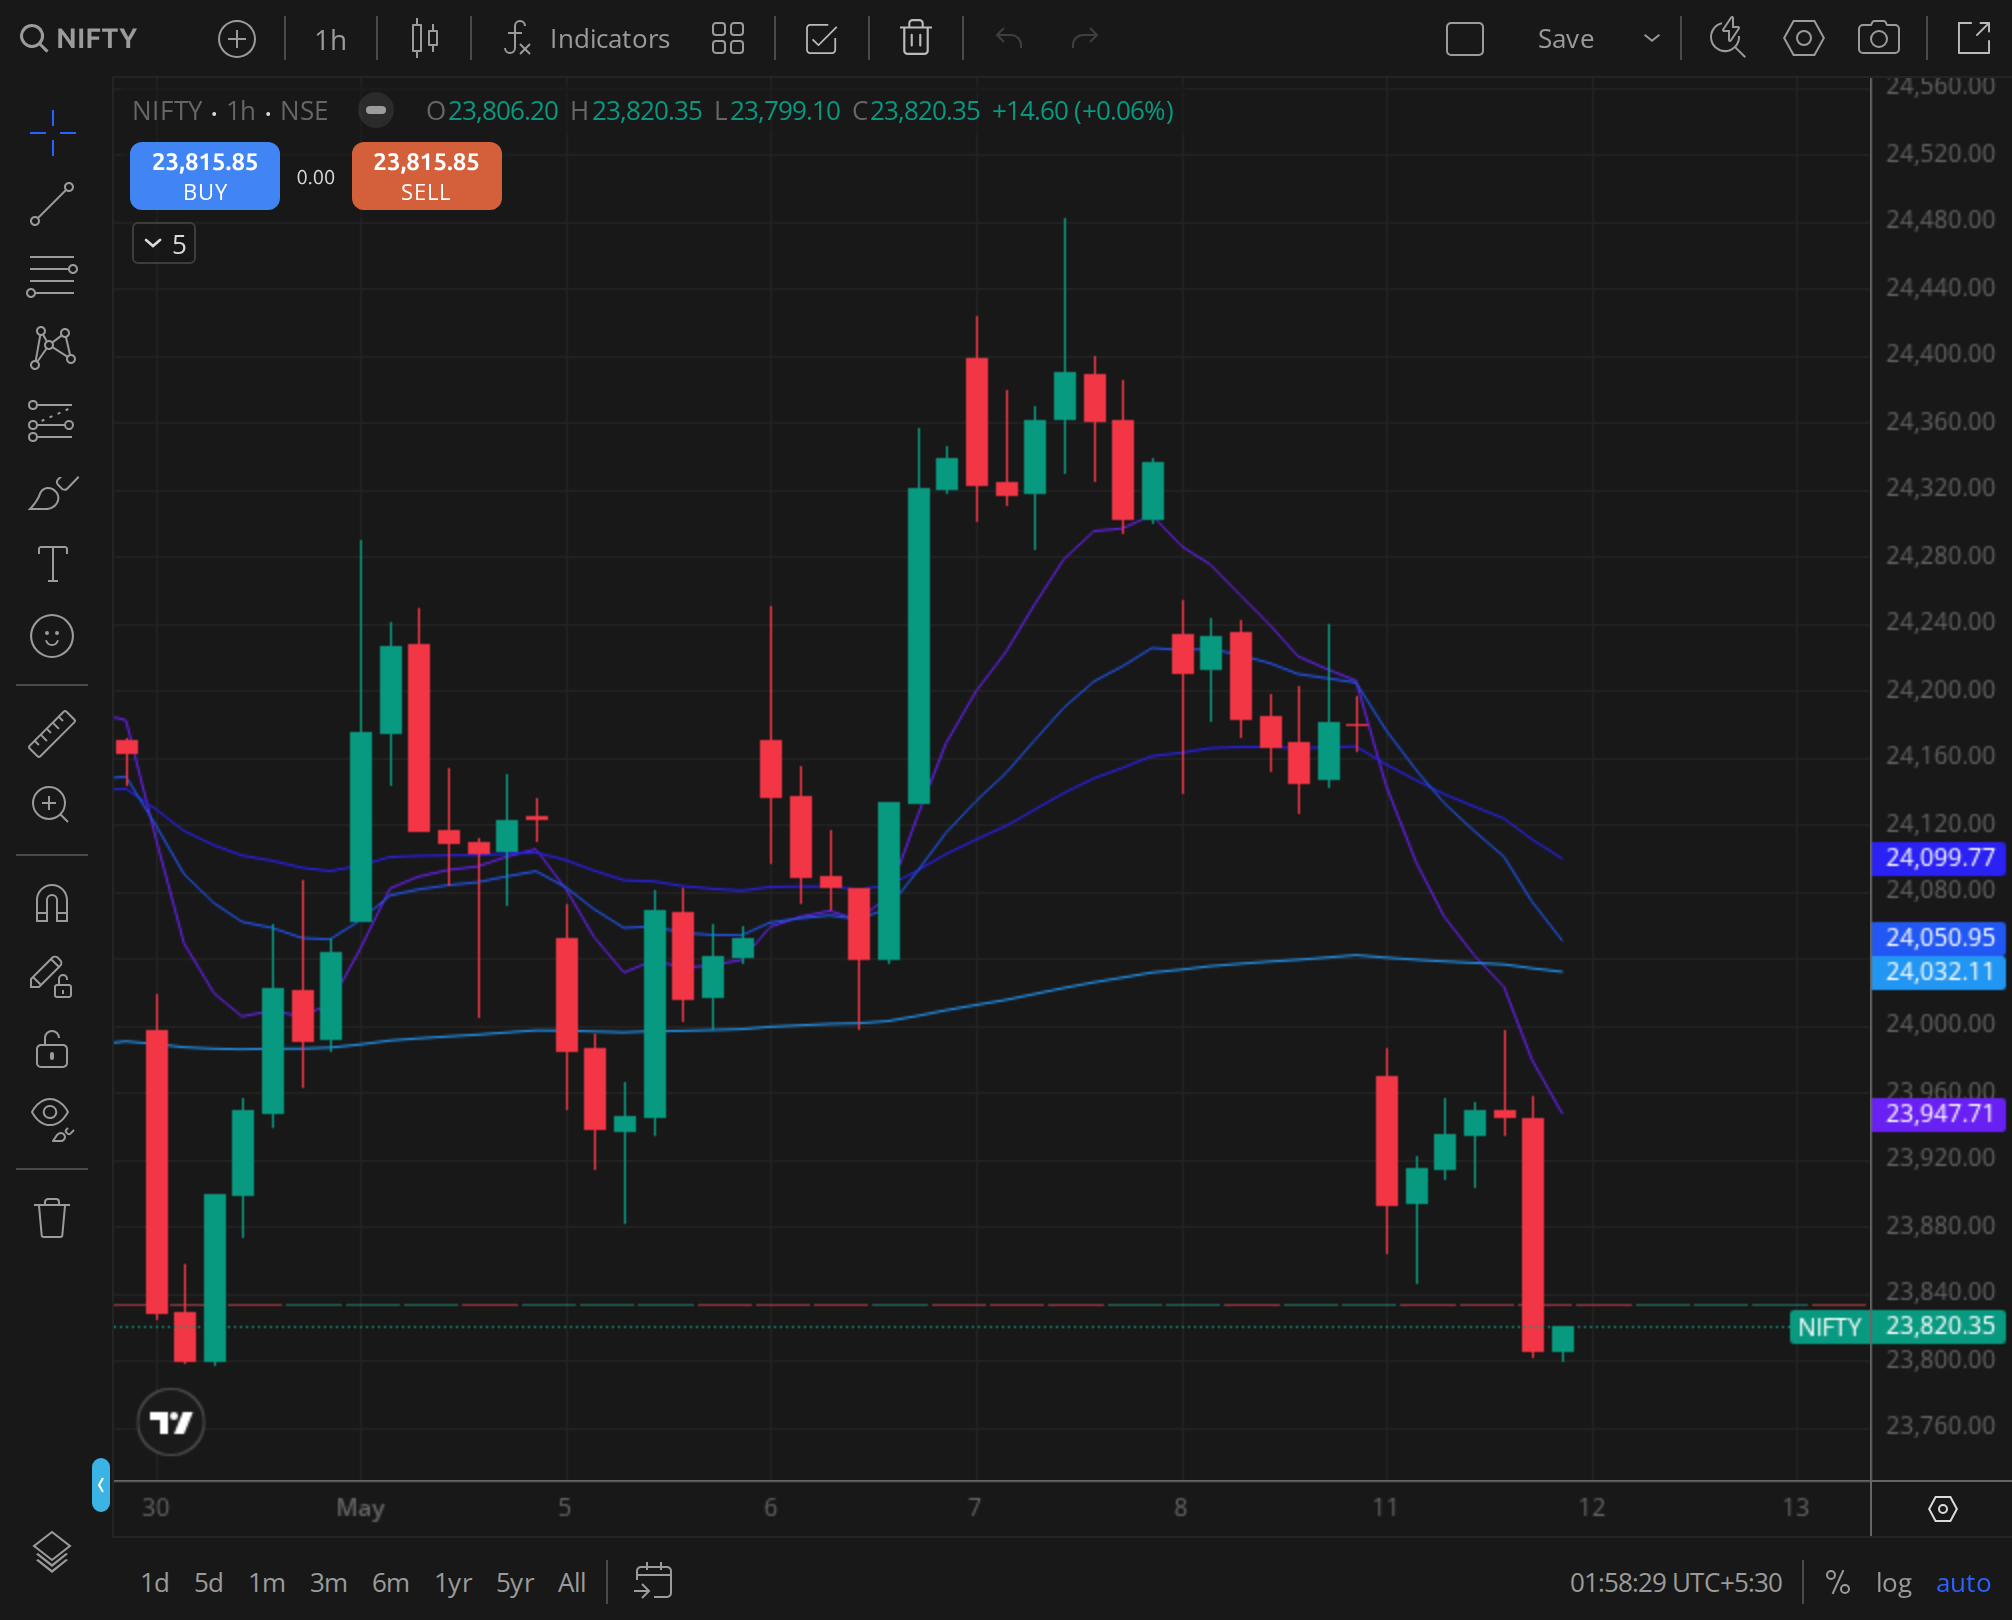
Caption: NIFTY 30min timeframe around 2025-04-25.
The Expiry Setup: OI Buildup Pattern
The foundation for the April 25 pin was laid weeks in advance, as the Nifty options chain began accumulating outsized open interest at the 24,800 strike. In the first week of April, when the index was trading near 24,200, the max pain calculation pointed to 24,500, a level that seemed distant but not unreasonable given the prevailing uptrend. However, as the series progressed, a distinct pattern emerged. Call writers aggressively sold the 25,000 and 25,200 strikes, while put writers concentrated their activity at 24,500 and 24,600. The 24,800 strike, initially a minor player, started to attract significant volume from both sides. By April 18, with seven sessions left to expiry, the open interest at 24,800 CE and 24,800 PE together surpassed 80 lakh shares, making it the strike with the highest combined OI. This shift was accompanied by a gradual rise in the max pain value itself, which moved from 24,500 to 24,700 and finally to 24,800 by April 22, where it remained anchored for the final three days.
The weekly chart of Nifty during this period illustrated the consolidation that enabled this accumulation. After a sharp rally in late March, the index entered a tight range between 24,600 and 25,000, with the 20-week EMA providing support near 24,400 and the 50-week EMA acting as a ceiling around 25,100. Volume on the weekly timeframe tapered consistently, a sign that directional conviction was waning. The weekly chart, embedded below, captures this structure: a series of small-bodied candles with long shadows, indicating a tug-of-war that neither bulls nor bears could decisively win. The declining volume suggested that institutional participants were reducing their cash market activity and shifting their focus to the derivatives segment, where the real battle was unfolding.
On the daily timeframe, the OI buildup was even more instructive. The 20-day moving average flattened near 24,750, while the 50-day moving average sloped gently upward around 24,550. The 200-day moving average sat far below at 23,800, reinforcing the structural bull trend. The daily RSI hovered in the 48-52 zone for most of April, never reaching overbought or oversold territory. This neutral momentum reading discouraged breakout traders and encouraged option sellers to write premium, confident that the index would remain rangebound. The daily chart, shown below, highlights how the index oscillated around the 20DMA, with volume spikes occurring only on the few days when the index tested the range boundaries. The real story, however, was in the options data. Each morning, the exchange’s open interest report showed fresh additions at 24,800, often in the form of straddle and strangle sales. Market makers, sensing the lack of a catalyst, built a massive gamma wall that would later act as a magnet.
By the morning of April 25, the total open interest at the 24,800 strike had swelled to 1.2 crore shares, split roughly into 65 lakh shares in calls and 55 lakh shares in puts. The next highest strike, 25,000 CE, held 90 lakh shares, while the 24,500 PE had 80 lakh shares. The max pain calculation, which aggregates the rupee value of all outstanding options, yielded a precise figure of 24,800. This was not a coincidence, it was the result of weeks of deliberate positioning by institutional writers who understood that the index would be pulled toward the point of maximum option decay. The stage was set for a classic expiry day pin.
Strike Pinning Behavior and Max-Pain Accuracy
On April 25, the Nifty opened at 24,820, a mere 20 points above the max pain level. The first hour of trade saw a brief spike to 24,855, driven by a short covering burst in Bank Nifty, but the move was quickly sold into. By 10:30 a.m., the index had retreated to 24,810, and for the remainder of the session, it traded in an extraordinarily narrow 30-point band. The intraday 30-minute chart, displayed below, reveals the signature of a pinned market: price repeatedly tested the 24,800 level, with each dip being bought and each rally being sold. The volume-weighted average price (VWAP) for the day settled at 24,808, almost exactly at the max pain strike. The volume signature showed clusters of high activity at 24,800, with diminishing volume at higher and lower levels, confirming that algorithmic traders and market makers were actively defending the strike.
30-minute intraday chart of Nifty on April 25, 2025, highlighting VWAP and volume clusters that confirmed the pinning at 24,800.
The pinning behavior was not merely a statistical artifact, it was enforced by the mechanics of delta hedging. As the day progressed and time decay accelerated, the gamma of the at-the-money options skyrocketed. Market makers who had sold the 24,800 straddle needed to buy or sell the underlying in increasingly large quantities to remain delta neutral. Every time the index drifted higher, they sold futures, and every time it dipped, they bought. This self-reinforcing loop created an almost impenetrable barrier. The accuracy of the pin was remarkable: the index closed at 24,812, just 12 points from the max pain level, and the final half-hour saw a range of only 8 points. Traders who had bet on a breakout beyond 24,900 or a breakdown below 24,700 saw their option premiums evaporate, as the time value collapsed into the close.
The max pain accuracy on this expiry was consistent with a broader pattern observed throughout 2025. In the preceding three monthly expiries, the Nifty had closed within 0.5% of the max pain level each time. However, the April 25 expiry stood out because of the sheer size of the open interest concentrated at a single strike. The 1.2 crore share OI at 24,800 represented nearly 18% of the total market-wide open interest in Nifty options, an unusually high concentration. This concentration meant that the incentive for market makers to pin the index was enormous, the potential payout from the decay of those options ran into hundreds of crores. The pinning was so precise that even the final closing price calculation, which is based on the last 30 minutes of trading, showed a weighted average of 24,811.7, rounding to 24,812. The max pain model, often dismissed by fundamental analysts as a self-fulfilling prophecy, had once again demonstrated its predictive power when open interest is heavily skewed.
The behavior of Bank Nifty on the same day provided an interesting contrast. Bank Nifty’s max pain was at 52,500, but it closed at 52,620, a deviation of 120 points. The difference lay in the OI distribution: Bank Nifty had a more dispersed chain, with no single strike commanding more than 8% of total OI. This dispersion allowed the index to drift away from max pain, whereas Nifty’s hyper-concentration acted as a gravitational force. The lesson for traders was clear: max pain works best as a magnet when the options chain is dominated by one or two strikes, and the April 25 Nifty expiry was the quintessential example of that condition.
PCR and IV Crush Dynamics
The put-call ratio (PCR) based on open interest began the day at 1.35, reflecting a buildup of put positions relative to calls. This reading, often interpreted as a bullish signal because it indicates put writing (a bullish strategy), was misleading in the context of the expiry. A deeper look revealed that the high PCR was driven by massive put writing at 24,500 and 24,600, strikes that were comfortably out of the money given the index’s opening level. Meanwhile, call writing at 24,800 and 25,000 was equally aggressive, keeping the overall positioning in balance. As the session progressed and the index refused to move, the PCR on volume told a different story. Call volumes surged in the final two hours as traders scrambled to cover short call positions or buy back calls that were expiring worthless. The volume PCR dropped from 1.20 at noon to 0.85 by the close, a sign that call activity dominated the late session. This shift was typical of a pinned expiry, where the initial OI-based PCR gives a false sense of direction, while the volume PCR reveals the last-minute adjustments of option sellers.
The implied volatility (IV) crush on April 25 was severe and swift. At the start of the day, the at-the-money IV for Nifty options stood at 18.5%, elevated due to the uncertainty around the expiry and a minor geopolitical headline that had surfaced the previous evening. By 2:00 p.m., as the pinning became evident, IV began to collapse. The final hour saw a vertical drop to 10.2%, a decline of over 8 percentage points. This IV crush decimated the value of out-of-the-money options, which had been holding premium in the hope of a late breakout. The VIX, India’s fear gauge, mirrored this move. The spot VIX fell from 16.2 to 13.8 during the day, while the VIX futures for the next series dropped from 17.5 to 15.0. The message was unambiguous: uncertainty had evaporated, and the market was pricing in a continuation of the low-volatility regime.
The dynamics of the IV crush were intimately tied to the max pain pinning. When the index is pinned, the probability of a large move diminishes rapidly, and option prices adjust by shedding their time value and volatility premium. For straddle and strangle sellers, this was the ideal scenario. They had collected premium when IV was high and bought it back for a fraction of the price as IV collapsed. The gamma scalping activity of market makers, which kept the index rangebound, directly caused the IV crush. It was a feedback loop: the more the index was pinned, the faster IV fell, and the faster IV fell, the less incentive there was for anyone to push the index out of the range, because the potential profits from a breakout were shrinking by the minute. This self-reinforcing cycle was the engine that drove the expiry to its precise conclusion.
The PCR and IV data for the entire April series showed that the market had been gradually pricing in a low-volatility expiry. The 30-day historical volatility had declined from 22% at the start of April to 14% by April 24. The VIX futures curve was in contango, but the spread had narrowed significantly, indicating that traders expected the low-volatility environment to persist. The April 25 expiry was the culmination of that trend, a day when the volatility risk premium was harvested by institutional sellers at the expense of retail buyers who had overpaid for options earlier in the series.
FII vs Retail Positioning Divergence
The derivative positioning data from the National Stock Exchange revealed a stark divergence between foreign institutional investors (FIIs) and retail traders throughout the April series. FIIs, who had been net sellers in the cash market for much of the month, maintained a bearish tilt in index futures. As of April 24, their long/short ratio in index futures stood at 32:68, meaning that for every 100 contracts, 68 were short. This was a significant increase positions from the start of the series, when the ratio was 45:55. In stock futures, FIIs were also net short, with a long/short ratio of 48:52. The cumulative net short position in index futures had reached 1.8 lakh contracts by expiry eve, the highest since February 2025. This positioning suggested that FIIs were hedging their cash market exposure or outright betting on a correction.
In contrast, retail traders were overwhelmingly bullish. The client category, which includes retail and high-net-worth individuals, showed a long/short ratio of 72:28 in index futures, a near mirror image of the FII stance. In stock futures, retail was even more bullish, with a ratio of 78:22. The options data reinforced this divergence. Retail traders were heavy buyers of call options, particularly the 25,000 and 25,200 strikes, while FIIs and proprietary desks were the dominant sellers of those same calls. The net open interest in calls at strikes above 25,000 was largely held by retail, while the writers were institutions. This set up a classic conflict: retail was positioned for a breakout, while institutions were positioned for a rangebound or declining market.
The expiry day action resolved this conflict decisively in favor of the institutions. As the index pinned at 24,800, the out-of-the-money calls bought by retail expired worthless, transferring the premium to the institutional sellers. The FII short positions in index futures, however, did not fully benefit because the index did not fall, it remained flat. Many FIIs used the expiry to cover a portion of their shorts, as evidenced by the drop in their net short position from 1.8 lakh contracts to 1.5 lakh contracts by the end of the day. This covering provided a mild bid to the market but was not enough to break the pin. The retail long positions in futures, meanwhile, were rolled over to the next series, indicating that retail remained hopeful of a post-expiry rally.
The divergence between FII and retail positioning was a warning sign for the following week. Historically, when retail is excessively bullish and FIIs are bearish, the market tends to follow the FIIs’ lead, often with a lag. The pinning at max pain, while a victory for option sellers, did not resolve the underlying tension. The cash market volumes on April 25 were subdued, at just 0.8 times the 20-day average, suggesting that the big money was waiting for the expiry to pass before committing to a direction.
Verdict: What the Expiry Told Us About the Following Week
The April 25 expiry left behind a trail of clues for the sessions ahead. First, the successful defense of the 24,800 max pain level and the subsequent IV crush indicated that the market was comfortable with the current price zone. The low VIX reading of 13.8 at close was a signal that fear had been wrung out, which historically has been a contrarian indicator, extremely low VIX often precedes a volatility spike. Second, the rollover data showed that only 65% of the Nifty futures positions were rolled to the May series, below the three-month average of 72%. This lower rollover suggested that many traders were unwilling to carry positions into the new series, possibly due to uncertainty about the upcoming earnings season and the Reserve Bank of India’s policy meeting scheduled for the first week of May.
The FII short covering that began on expiry day continued into the next week, with the net short position in index futures declining further to 1.2 lakh contracts by April 30. This covering, combined with the low rollover, created a mild short squeeze that pushed the Nifty to 25,100 by May 2. The retail traders who had rolled their long positions were rewarded, but the move was not explosive. The volume on the breakout was below average, and the index struggled to sustain above the 25,000 mark. The max pain for the May series, as calculated on April 28, had shifted to 25,000, indicating that the market’s center of gravity had moved higher but not decisively so.
The PCR and IV data in the immediate aftermath of the expiry confirmed a cautious optimism. The OI PCR for the May series started at 1.20, a neutral reading, while the IV on at-the-money options remained subdued at 14%. The VIX futures curve flattened, with the spot VIX hovering around 14.5 and the next-month futures at 15.2, suggesting that the market was pricing in a gradual increase in volatility rather than a sudden spike. The overall picture was one of a market that had absorbed the expiry event without damage and was now looking for a fresh catalyst. The April 25 pinning had served its purpose: it cleared the decks of excessive open interest and reset the options chain for the next series.
VERDICT
Stance: NEUTRAL (5-day), BULLISH (1-month), NEUTRAL (3-month)
The immediate aftermath of the April 25 expiry presented a neutral setup for the following five trading sessions. The low VIX and the successful pin at max pain suggested that the market lacked the energy for a large directional move in the short term. The FII short covering provided a tailwind, but the low rollover and the upcoming RBI policy created enough uncertainty to cap the upside. The index was likely to trade in a 24,800 to 25,200 range, with a slight upward bias as the short squeeze unfolded. Traders were advised to adopt a delta-neutral strategy, selling strangles or iron condors, to capitalize on the expected rangebound action and the still-elevated option premiums in the early part of the new series.
Over a one-month horizon, the outlook turned bullish. The structural trend remained intact, with the 200-day moving average rising and the earnings season expected to deliver positive surprises. The FII short covering, if it continued, would provide a steady bid. The max pain pinning had cleared the overhang of a concentrated strike, allowing the market to establish a new equilibrium. A break above 25,200, if accompanied by volume, would open the path to 25,800. The three-month view, however, reverted to neutral. The low VIX environment could not persist indefinitely, and a volatility event, possibly triggered by global factors or a domestic policy shock, was likely. The divergence between FII and retail positioning, though temporarily resolved, could re-emerge and cause a sharp correction. The April 25 expiry was a masterclass in market mechanics, but it also served as a reminder that max pain pinning is a tactical phenomenon, not a strategic one. The broader market narrative would eventually reassert itself.