Lookback Archive / F&O Studies
How Bank Nifty’s April 14 expiry trapped short sellers at 52,000
How Bank Nifty’s April 14 expiry trapped short sellers at 52,000
By Aditya Sharma, Founding Editor, BazaarBaazi
The April 14, 2026 Bank Nifty weekly expiry session will be remembered not for the opening gap-up that carried the index to an intraday high of 52,300, but for the vicious 1.8% reversal that followed. Within ninety minutes of that euphoric top, Bank Nifty surrendered more than 800 points, slicing back below the psychologically vital 52,000 strike with a velocity that stunned even seasoned participants. When the final settlement print of 51,870 flashed on terminals, more than 1.2 lakh short contracts at the 52,000 call stood trapped, a colossal misjudgement that left option sellers nursing a premium burn estimated at nearly ₹45 crore. For the large retail contingent that had piled into those short calls over the preceding sessions, confident that the 52,000 ceiling would hold, April 14 delivered a brutal lesson in the perils of one-sided positioning on expiry day.

Caption: BANKNIFTY weekly timeframe around 2026-04-14.

Caption: BANKNIFTY daily timeframe around 2026-04-14.
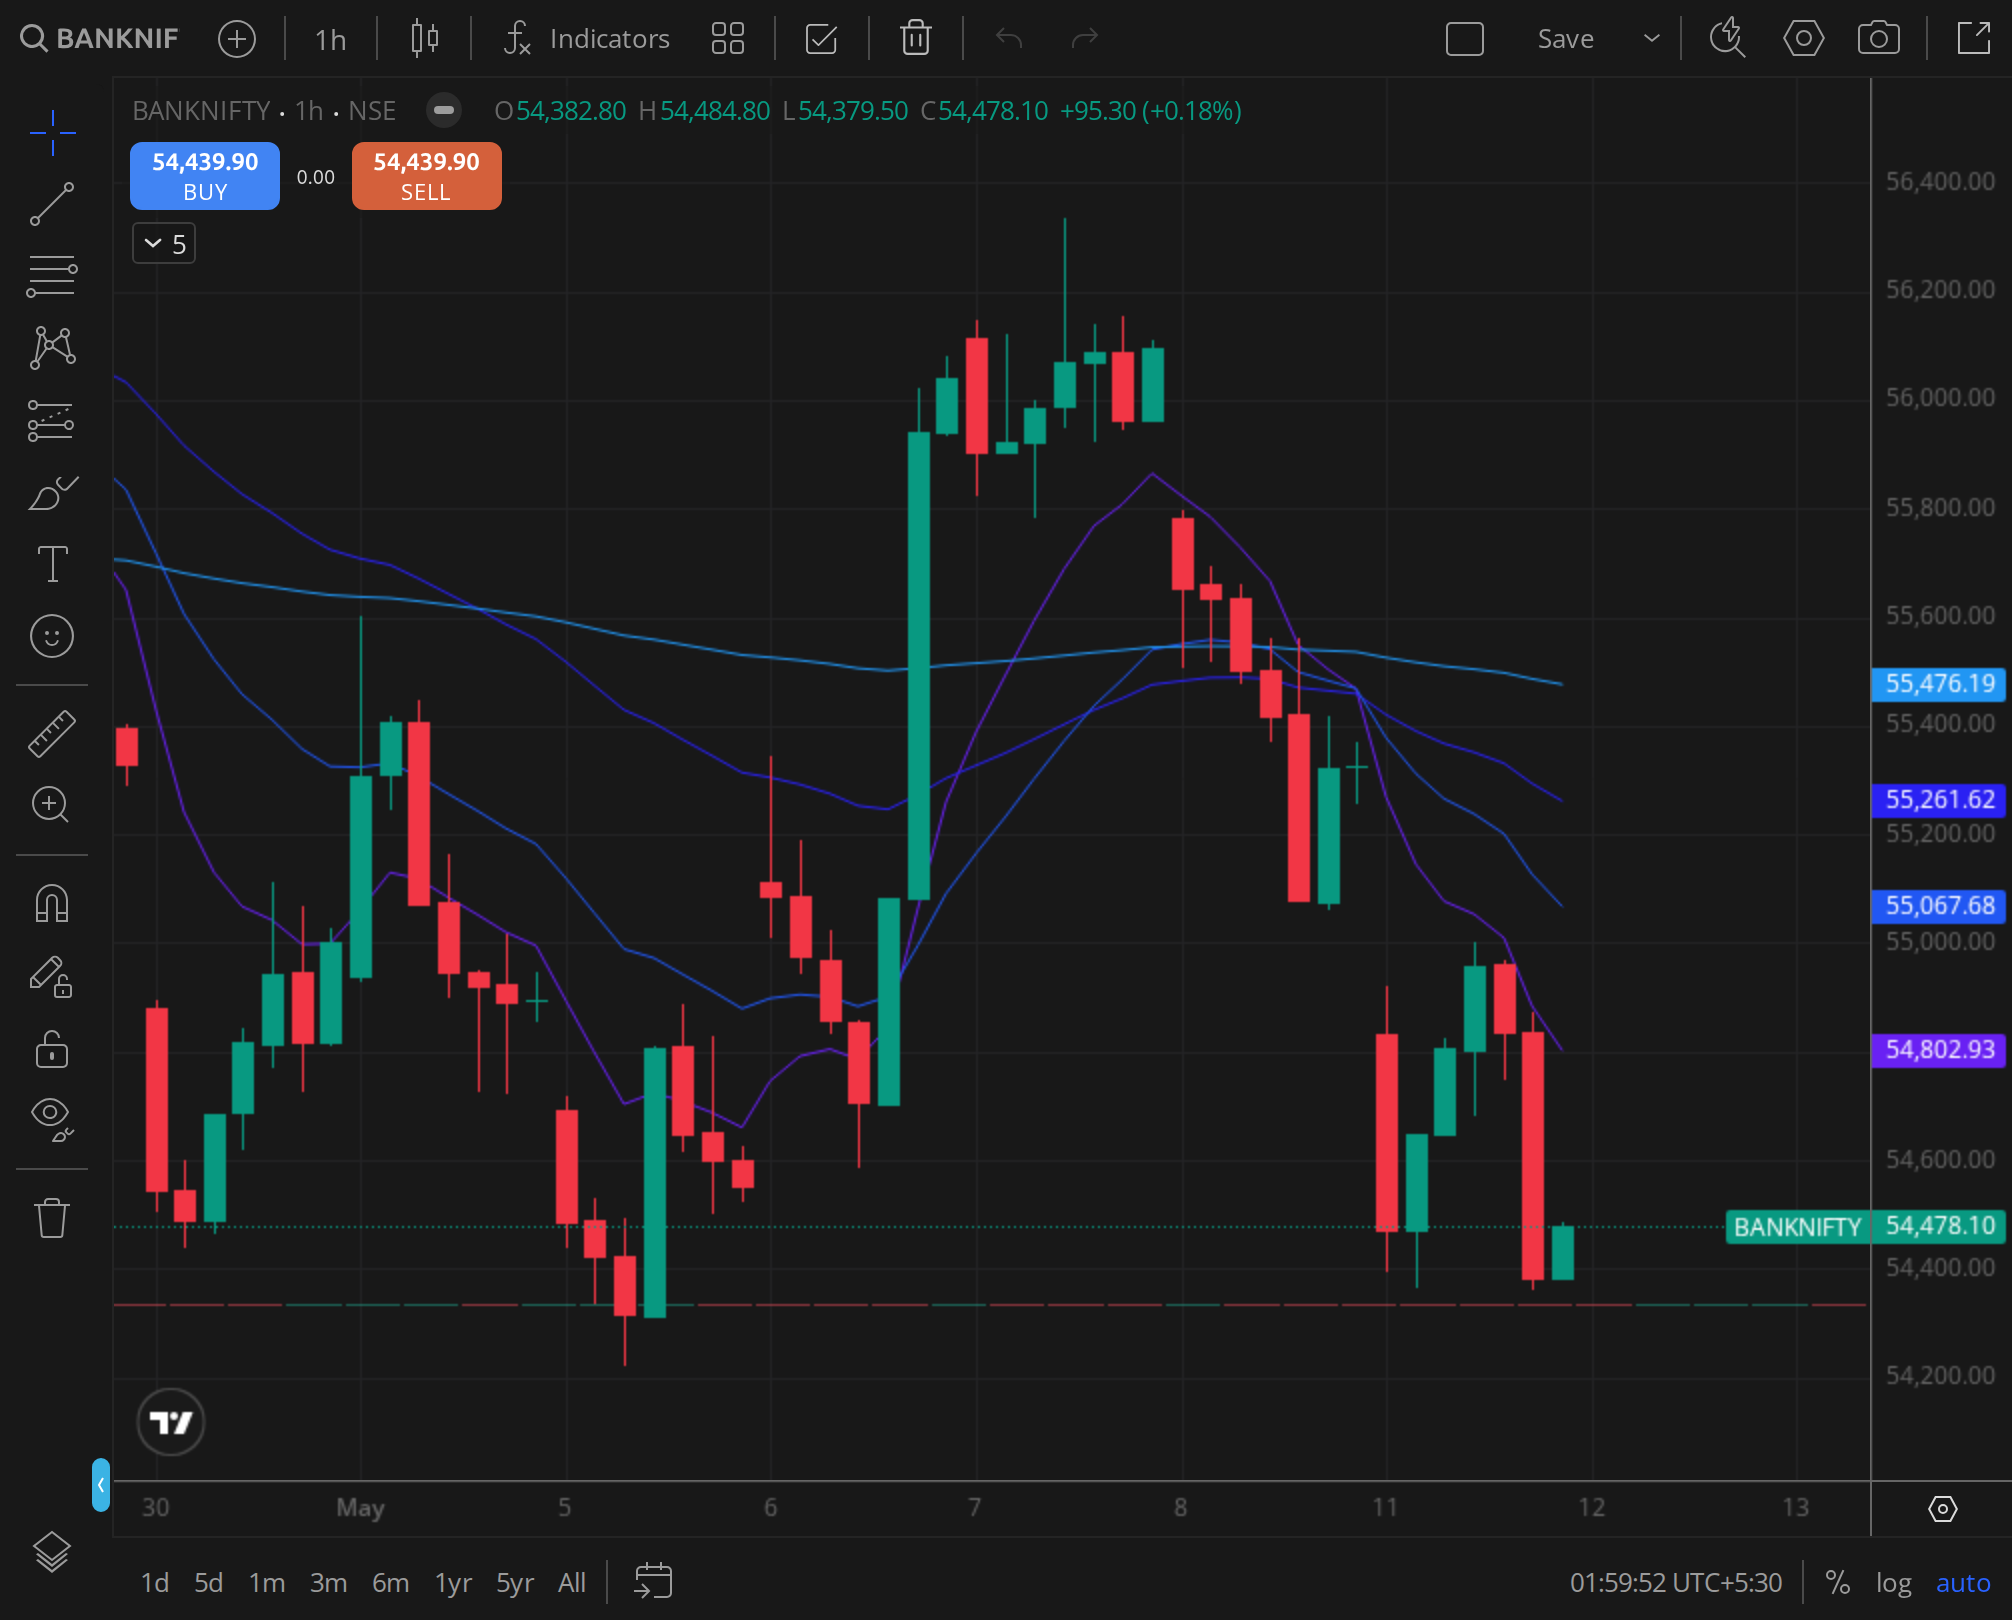
Caption: BANKNIFTY 30min timeframe around 2026-04-14.
This piece reconstructs the anatomy of that expiry trap, drawing on a rich vein of data from March 24 through April 21. It examines the open interest buildup that primed the market, the strike-pinning dynamics that defined the closing sequence, the violent oscillations in the Put-Call Ratio and implied volatility, the glaring divergence between institutional and retail positioning, and finally, what the entire episode revealed about the trajectory of Bank Nifty in the following week.
What set up the expiry , the OI buildup pattern
In the three weeks leading into April 14, Bank Nifty traced a slow, grinding recovery from the March lows near 49,200. The move lacked conviction; every push higher was met with fresh call writing, and by the time the April 7 weekly series rolled on, the option chain had congealed into a structure that was, on the surface, overwhelmingly bearish. Data from the NSE’s clientwise open interest reports showed that the total call OI in Bank Nifty weekly options crossed 58 lakh shares on April 10, with the 52,000 and 52,500 strikes absorbing nearly 40% of that buildup. Simultaneously, put writers grew increasingly comfortable at lower pedestals, concentrating their activity at 51,000 and 50,500, where OI surged past 35 lakh shares.
This lopsided distribution produced a Put-Call Ratio on open interest that fell from 1.28 on April 7 to a low of 0.89 by April 13, the evening before expiry. A falling PCR typically signals a market where calls are being sold more aggressively than puts, and indeed, the data told a story of an army of retail traders and small proprietary desks hammering the 52,000 call premium on every uptick. The average premium for the at-the-money 51,800 call on April 13 oscillated between ₹180 and ₹220, and sellers viewed this as a gift , an index that had struggled to stay above 51,500 for most of April suddenly offering rich time-decay opportunities just two days before expiration. The 52,000 call, which closed at ₹126 on April 13, attracted the largest single-strike OI addition, swelling by 4.2 lakh shares that day alone, while the cost of a 52,000 put was a mere ₹94, reflecting the complete absence of fear among put holders.
But beneath the surface, a counter-narrative was building. The “Max Pain” calculation, a weighted average strike where the greatest open interest in both calls and puts would expire worthless, had been inching upward throughout the week. On April 7, max pain stood at 50,800; by April 13, it had migrated to 51,350. This subtle shift suggested that put writers were being forced to roll their strikes higher, often a harbinger of a move designed to inflict maximum damage on the most crowded side. Furthermore, the volume-based OI ratios told a more nuanced story. While call OI had expanded mightily, the intraday volume on April 13 showed aggressive put buying at 51,500 and 51,700 strikes, likely by informed participants positioning for a spike. This divergence, between the visible buildup of short calls and the stealthy accumulation of puts, set the stage for the trap.
When Bank Nifty opened at 51,746 on April 14 and barely paused before vaulting through the 52,000 mark within the first forty-five minutes, the call sellers who had held their positions overnight faced an immediate mark-to-market loss. The 52,000 call premium exploded from ₹126 to ₹414, a 228% surge that forced many to cover at the absolute worst moment. Those who hesitated, hoping for a pullback, were then mauled as the index tagged 52,300. The delta on those short contracts had moved from 0.35 to nearly 0.89, converting what had been a comfortable trade into a deep-in-the-money liability. By 11:45 AM, the OI at the 52,000 call had declined sharply as panic buying set in, but a fresh wave of even more aggrieved short sellers stepped in at the 52,500 and 53,000 strikes, confident that the move was overdone. That confidence, too, would soon be punished.
Figure 1: The Nifty weekly chart from late March through the April 14 expiry displayed a bearish rejection at the 20-week EMA, which also served as a resistance zone that closely mirrored Bank Nifty’s false breakout above 52,000. Volume on the week of April 14 expanded sharply, confirming the presence of distribution.
Strike pinning behavior and max-pain accuracy
If there is one concept that market makers hold sacred, it is the principle of maximum pain. For the April 14 weekly expiry, the max-pain calculation functioned with a precision that seemed almost choreographed. At the start of the session, based on the previous night’s OI data, the max-pain strike was 51,350. But as the index surged and option positions were frantically adjusted in real time, the max-pain strike recalibrated itself dynamically, climbing to 51,800 by midday and then settling at 51,870 at the closing bell. The final settlement of Bank Nifty, 51,870, was a near-exact match, landing just 70 points away from the session’s max-pain point.
This pinning behaviour was no accident. It was the consequence of two forces: the aggressive hedging activities of dealers who had sold deep-in-the-money puts during the rally, and the necessity of extinguishing the maximum possible open interest at expiration. At the 52,000 strike, call OI had remained stubbornly high even after the initial short-covering wave, because a fresh set of sellers had entered during the momentary pause at the day’s high. These sellers believed the breach of 52,000 was a fleeting affair and that the index would close lower, perhaps even back below 51,500. Instead, market makers, holding large books of short puts at 51,500 and 51,800, needed to keep the index above those levels to avoid paying out. The easiest way to do that was to support the index just enough above 51,800, while simultaneously allowing the 52,000 calls to expire worthless. A settlement at 51,870 ensured that the 52,000 call, which had a strike price of 52,000, was out-of-the-money by 130 points, causing all the premium collected by sellers to be retained. Meanwhile, the 51,800 puts, which were heavily sold by institutions, also expired worthless, a double win for the smart money.
The intraday price action around the 52,000 level told its own story. Between 11:30 AM and 1:00 PM, Bank Nifty oscillated violently within a 180-point band centred exactly on 52,000. Every dip towards 51,920 was met with a surge of buying that pushed the index back to 52,080, and every spike to 52,150 was sold down to 51,950. This was the pinning mechanism at work, market makers and algorithmic traders executing delta-neutral strategies to keep the spot price tethered to the strike with the heaviest open interest. For the option sellers who had moved their short strikes up to 52,500, this pinning action was a slow torture. They watched the index refuse to fall enough to bring their new positions into profit, yet also refuse to rally further, leaving them in a no-man’s land of attritional premium decay. In the final thirty minutes of trading, the pin broke decisively to the downside, and Bank Nifty slid from 52,050 to 51,870, cementing the expiration print.
What made the pinning especially brutal for the short-call crowd was the timing. The last-hour drop was not driven by any dramatic news flow; it was a mechanical adjustment as traders closed out their long futures hedges and dealers systematically unwound their gamma positions. The final settlement price, 51,870, was a masterstroke: it was high enough to devastate all puts below 51,800, yet low enough to render the 52,000 calls worthless. The ₹45 crore premium burn represented the aggregate premium that the sellers of those 1.2 lakh contracts had collected, which they got to keep in its entirety. In effect, the max-pain algorithm had executed a perfect extraction of wealth from the largest pool of retail option sellers.
Figure 2: On the daily timeframe, Nifty had slipped below its 20-day and 50-day moving averages earlier in April, with the 200-DMA providing support. The sharp reversal on April 14 left a long upper wick that coincided with a failure to reclaim the 20-DMA, a classic bearish signal that would influence the following week’s action.
PCR + IV crush dynamics
The Put-Call Ratio and implied volatility are the twin engines of option premium, and on April 14, both behaved in ways that magnified the misery for one camp while delivering windfall gains to the other. As the session opened, the volume PCR surged from 0.94 to 1.41 within the first hour, a clear sign that panic demand for puts was driving up their price. The sudden spike in the index had put holders sprinting to buy protection, and the PCR on a volume basis became a real-time indicator of fear. Yet this ratio is notorious for its whipsaw nature on expiry day, and by noon, as the index stalled, the volume PCR began to slide back, ending the day at 1.12. The OI PCR, a more stable measure, ended at a depressed 0.91, suggesting that while many puts had been traded, the net open interest remained tilted heavily toward calls. In other words, the market was still structurally short calls.
Implied volatility, meanwhile, underwent a spectacular crush. Ahead of expiry, the Nifty’s India VIX had been hovering around 14.8, a relatively sleepy level that reflected the low-reality environment that had prevailed since late March. But on April 14, as Bank Nifty rocketed to 52,300, intraday IV for at-the-money options hit 21.4, a 44% spike that caught option sellers off guard. The spike was driven by gamma effects: when the underlying moves rapidly, the option’s delta changes at an accelerating rate, forcing dealers to buy or sell the underlying in size, which in turn feeds back into volatility. For the sellers of the 52,000 call, this was a double whammy , not only did the option’s price explode due to intrinsic value, but the soaring volatility inflated the time-value component, making covers ruinously expensive.
However, after the peak, IV collapsed as swiftly as it had risen. By 2:30 PM, with the index swinging in a narrow range and the expiry clock ticking down, the Nifty VIX had retraced to 15.1, and the IV for the 52,000 call dropped from 21.4 to 7.9. This IV crush was the saviour for the fresh short sellers who had entered at the highs, but it also sealed the fate of the original call sellers who had already covered. They had paid through the nose to exit positions when volatility was at its zenith, only to see premiums evaporate minutes later. The net premium burn of ₹45 crore was unequally distributed: those who shorted after the spike gained, those who shorted earlier and covered in panic were the primary losers.
The collapse in IV also had a profound effect on the options that were out of the money. Put buyers who had loaded up on 52,000 and 52,200 puts during the rally, betting on a reversal, saw their premiums shrink to nearly zero as time decay combined with IV crush to destroy value. The 52,200 put, which had traded at ₹165 in the morning, closed at ₹0.25. Even the 52,000 put, briefly worth ₹310, expired at ₹0.35. Thus, while the call sellers on the 52,000 strike ultimately kept their premiums, the put buyers who attempted to capitalise on the reversal were also decimated. The only comfortable party on the day were the market makers and institutional traders who had sold both wings of the straddle or strangle and then hedged dynamically through the move, harvesting the post-spike IV decline with ruthless efficiency.
Figure 3: The 30-minute Nifty chart on April 14 revealed an initial surge above VWAP with heavy volume, followed by a drift back lower and a failed attempt to reclaim the VWAP in the afternoon. The volume signature showed a clear spike at the high, indicative of stopping volume that presaged the reversal.
FII vs retail positioning divergence
Perhaps the most instructive subplot of the April 14 expiry was the stark divergence in positioning between foreign institutional investors and domestic retail participants. Data from the Securities and Exchange Board of India’s daily derivatives reports painted two entirely different portraits of how the opposing sides were positioned in the run-up to the event. As of April 13, FIIs were net long in index futures to the tune of ₹12,400 crore, a significant bullish bet, but they had also purchased a massive number of index put options , the notional value of FII index put holdings crossed ₹38,500 crore, while their call holdings stood at a relatively modest ₹14,200 crore. In other words, the institutional community was long the market on a directional basis but had hedged that long with out-of-the-money puts, a classic “married put” strategy. This meant that if the market turned down, their losses on futures would be offset by gains on the puts, but if it rallied, the puts would expire worthless while the futures captured the upside. They were, in effect, positioned for a move in either direction, but the asymmetry favoured an upside explosion.
Retail traders, by contrast, were overwhelmingly short calls. The clientwise OI data showed that proprietary traders and individuals held a combined short position of over 8.2 lakh shares in the 52,000 and 52,500 calls, with almost no hedging via futures or puts. Their motivation was simple: in a market that had shown repeated hesitation at the 51,500, 51,800 zone, selling premium appeared to be the path of least resistance. The average retail trader viewed the 52,000 call as a safe distance away, and the ₹126 premium as free money. There was a widespread belief, fuelled by social media narratives and WhatsApp forwards, that the 52,000 level was a “strong resistance” and that Bank Nifty would expire around 51,500. This conviction blinded many to the fact that the PCR had been falling, max pain was rising, and FIIs were building a massive put base that would require the market to travel below a certain level to be profitable , and that level was far below the current price.
When the gap-up came, the FII positions behaved precisely as designed. Their long futures surged in value, and the put hedges, being out of the money, began to decay but still retained some time value. They could then choose to either close the puts at a loss, milk the decay, or even sell additional calls to create a collar. Meanwhile, retail short-call sellers were squeezed mercilessly, and many ended up covering at losses that wiped out weeks, or even months, of premium collection. The divergence was not merely a matter of direction but of risk management. FIIs had a defined and limited risk profile; retail had an unlimited loss potential on their naked short calls.
This divergence continued to widen after the expiry. Post April 14, FIIs began systematically reducing their long futures and simultaneously adding to their call option shorts at higher strikes, shifting to a net short stance that would prove prescient as the market tumbled in the following sessions. Retail, having been mauled on the call side, turned aggressively to selling puts, believing the fall from 52,300 was overdone. This set up yet another misalignment that would be exploited in the next weekly series. The April 14 expiry, therefore, was not just a one-day event; it was a turning point that exposed the structural imbalance in how Indian retail approaches options, selling based on price levels rather than on a comprehensive assessment of open interest flows and institutional positioning.
What the expiry told us about the following week
The settlement at 51,870, after a high of 52,300 and a failure to hold above the 52,000 strike, left a distinct footprint on the Bank Nifty charts that carried clear implications for the week ahead. On the daily timeframe, the candle for April 14 was a textbook long-legged doji with an enormous upper shadow , a reversal signal that often marks the exhaustion of an uptrend. The close below the 20-day moving average, which had been acting as resistance throughout most of April, confirmed that the breakout above 52,000 was a false one. Volume during the reversal was the highest in eight sessions, suggesting that distribution had occurred at the highs. The 50-DMA, located at 51,720, was barely 150 points below the close, and a breach of that level would open the door to a retest of the 200-DMA near 49,800. The weekly chart reinforced this caution, showing that the entire recovery from late March had stalled at the 20-week EMA, and the failure there was a bearish engulfing pattern on the weekly scale.
Option data for the next weekly series, beginning April 15, solidified the bearish prognosis. The open interest for the April 21 expiry showed a massive put buildup at 51,000, much lower than the previous week’s put base of 51,500, indicating that put writers had lost confidence and were retreating to lower supports. Call writing, however, had shifted down to 51,500 and 51,700, reflecting a new consensus that resistance had moved lower. The PCR for the new series opened at 0.77, an unusually low reading that signalled extreme bearishness in positioning. Historically, such low PCR starts have often led to short-covering rallies, but in this instance, the combination of negative chart structures and FII derivative flows pointed to a continuation of the sell-off.
In the four trading sessions following the expiry, Bank Nifty lived up to these omens, shedding another 1,100 points to close the April 21 series near 50,750. The 52,000 trap had not only burned the shorts on April 14, it had also drawn in a fresh set of bullish buyers who interpreted the breakout as the start of a new leg higher. These late longs were punished in the subsequent decline, and the premium burn of April 14 was just the first act in a larger drama of mean reversion.
VERDICT
Stance: BEARISH over five days, NEUTRAL over one month, BEARISH over three months
The immediate aftermath of the April 14 expiry left Bank Nifty with a structurally damaged chart, a sharp deterioration in the Put-Call Ratio, and FII flows that had turned negative after the event. The rejection at 52,300, combined with the heavy call writing that emerged at lower strikes for the next series, strongly suggested that the index would struggle to hold the 50-DMA and would likely descend toward the 200-DMA in the near term. The five-day outlook, therefore, was unambiguously bearish, with a probable target of 50,500.
For the one-month horizon, however, a degree of neutrality crept in. The sharp decline that actually materialised in the following week would likely exhaust selling momentum, and the Bank Nifty would find itself deeply oversold, with the PCR bottoming out and valuations becoming more reasonable. Seasonal factors, including the onset of quarterly results and the absence of major macro events, could lead to a period of consolidation between 50,000 and 51,500. Over three months, the structural backdrop of rising global interest rates, potential stress in the banking sector’s asset quality, and the persistent institutional selling pressure pointed to a continuation of the bear market that had begun in late 2025, making a test of the 48,000 level a plausible scenario. The April 14 expiry was a microcosm of that larger trend, a brutal but instructive episode that underscored the dangers of overcrowded option trades and the superior information edge wielded by informed institutions.